


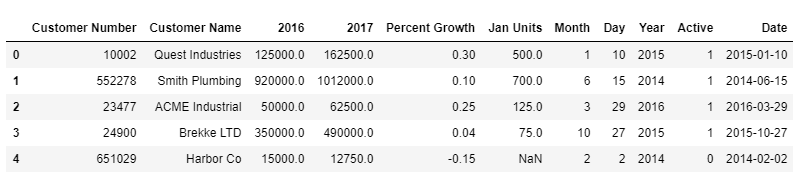
案例1 转化数据类型
!git clone https://github.com/qiwsir/DataSet.git

!ls DataSet
加载数据集
import pandas as pd
import numpy as np
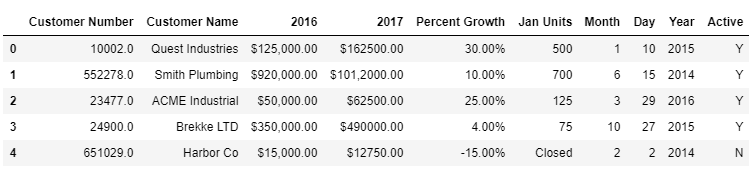
df = pd.read_csv("./DataSet/sales-data/sales_data_types.csv")
df
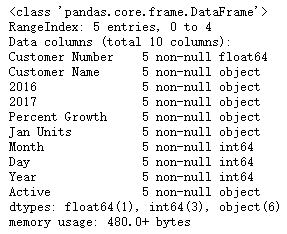
df.info()
help(df.astype)
Cast a pandas object to a specified dtype
dtype.
# column.astype
df['Customer Number'].astype(int)
help(pd.to_numeric)
Convert argument to a numeric type.
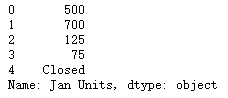
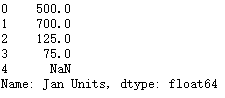
# pd.to_numeric
pd.to_numeric(df['Jan Units'], errors='coerce')
正则表达式
help(np.where)
Return elements, either form
xory, depending oncondition.
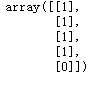
# 特征“Active”中的数据只有两种类型,按照要求用数字1和0来表示。
np.where(df[['Active']] == 'Y', 1, 0)
help(str.replace)
S.replace(old, new) -> str
Return a copy of S with all occurrences of substring old replaced by new. If the optional argument count is given, only the first count occurrences are replaced.
# str.replace
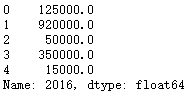
#特征“2016”和“2017”的数据表示的是资金额度,转化为字符串。
#但不能直接使用astype或者to_numeric,因为字符串中包含了非数字的字符“$”和“,”。
#为此,写一个函数专门来解决这个转化问题。
def convert_money(value):
new_value = value.replace("$","").replace(",","")
return float(new_value)
df['2016'].apply(convert_money)
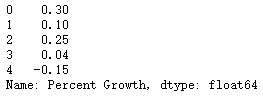
lambda
conv_fun=lambda x: float(x.replace("%", "")) / 100
df['Percent Growth'].apply(conv_fun)
help(pd.to_datetime)
Covert argument to datatime.
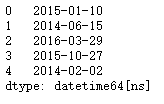
# 将表示年月日的三个特征“Year”“Month”“Day”,合成时间类型
pd.to_datetime(df[['Year', 'Month', 'Day']])
封装函数
import pandas as pd
import numpy as np

def convert_money(value):
    new_value = value.replace(",","").replace("$","")
    return float(new_value)

df2 = pd.read_csv("./DataSet/sales-data/sales_data_types.csv",
                  dtype={'Customer Number': 'int'},
                  converters={
                              '2016':convert_money,
                              '2017':convert_money,
                              'Percent Growth': lambda x: float(x.replace("%", "")) / 100,
                              'Jan Units': lambda x:pd.to_numeric(x, errors='coerce'),
                              'Active':lambda x:np.where(x =='Y', 1, 0),
                             }
                 )
df2['Date'] = pd.to_datetime(df[['Month','Day', 'Year']])
df2
案例2 处理缺失数据
将含有缺失数据的特征视为预测特征,找出规律,进行填补
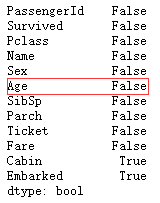
检查缺失数据
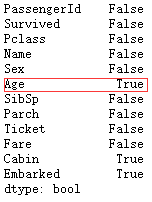
help(df.isna)
Detect missing values.
df.isna().any()
help(df.dropna)
Remove missing values
train_df.dropna().any()
根据规律填补
RandomForestRegressor预测
help(RandomForestRegressor)
A random forest regressor.
如果将“Age”作为样本标签,那么利用哪些特征可以预测它的值呢?
此处姑且主观地选择Fare(船票价格)、Parch(父母孩子在船上的数量)、
SibSp(兄弟姐妹或配偶在船上数量)、Pclass(客舱等级)几个特征作为自变量。
df = train_df[['Age','Fare', 'Parch', 'SibSp', 'Pclass']]
known_age = df[df['Age'].notnull()].values
unknown_age = df[df['Age'].isnull()].values

y = known_age[:, 0] #'Age'
X = known_age[:, 1:] #'Fare', 'Parch', 'SibSp', 'Pclass'

from sklearn.ensemble import RandomForestRegressor

rfr = RandomForestRegressor(random_state=0,
                            n_estimators=2000,
                            n_jobs=-1)

rfr.fit(X, y)

pred_age = rfr.predict(unknown_age[:, 1:])
pred_age.mean()
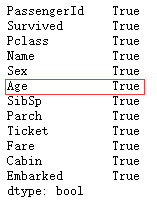
将预测值填补到特征age中
train_df.loc[(train_df.Age.isnull()), 'Age'] = pred_age
train_df.isna().any()
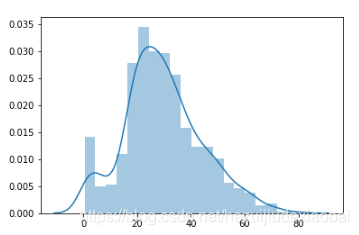
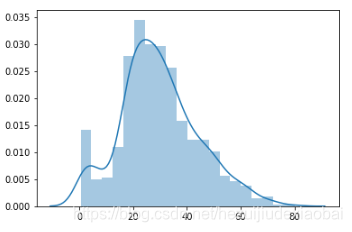
查看Age数据分布
填补前数据分布
%matplotlib inline
import seaborn as sns
sns.distplot(y)
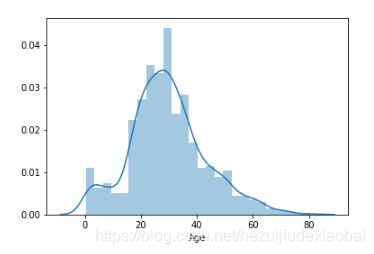
预测值填补后数据分布
sns.distplot(train_df['Age'])
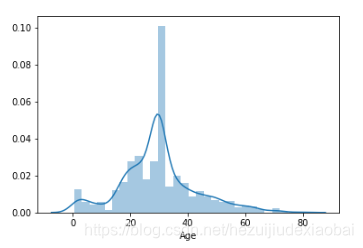
用指定值填补
平均值
# 如果简单地用平均值填补,分布效果如下图
train_df = pd.read_csv("./DataSet/kaggle/titantic/train.csv")
df_mean = train_df['Age'].fillna(train_df['Age'].mean())
sns.distplot(df_mean)
help(SimpleImputer)
Imputation transformer for completing missing values.
| strategy : string, optional (default=“mean”)
| The imputation strategy.
|
| - If “mean”, then replace missing values using the mean along
| each column. Can only be used with numeric data.
| - If “median”, then replace missing values using the median along
| each column. Can only be used with numeric data.
| - If “most_frequent”, then replace missing using the most frequent
| value along each column. Can be used with strings or numeric data.
| - If “constant”, then replace missing values with fill_value. Can be
| used with strings or numeric data.
train_df = pd.read_csv("./DataSet/kaggle/titantic/train.csv")

from sklearn.impute import SimpleImputer
si_mean = SimpleImputer(missing_values=np.nan, strategy='mean')
df_mean = si_mean.fit_transform([train_df['Age'].values])

sns.distplot(df_mean)
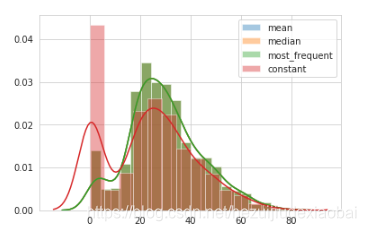
使用不同填充方式对比效果
train_df = pd.read_csv("./DataSet/kaggle/titantic/train.csv")
strategys = ['mean', 'median', 'most_frequent', 'constant']
for strategy in strategys:
    si_age = SimpleImputer(missing_values=np.nan, strategy=strategy).fit_transform([train_df['Age'].values])
    sns.distplot(si_age, label=strategy)

plt.legend()
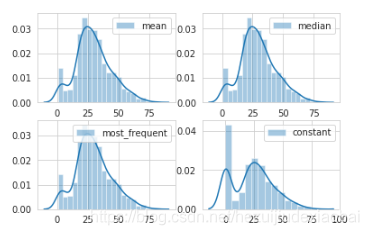
import matplotlib.pyplot as plt
fig = plt.figure()
i=0

train_df = pd.read_csv("./DataSet/kaggle/titantic/train.csv")
strategys = ['mean', 'median', 'most_frequent', 'constant']
for strategy in strategys:
    si_age = SimpleImputer(missing_values=np.nan, strategy=strategy).fit_transform([train_df['Age'].values])
    i = i+1
    fig.add_subplot(2, 2, i)
    sns.distplot(si_age, label=strategy)
    plt.legend()
案例3 处理离群值
加载数据集
from sklearn.datasets import load_boston
import pandas as pd

boston = load_boston()
x = boston.data
y = boston.target
columns = boston.feature_names

# 将数据集转化为DataFrame类型(操作方便)
boston_df = pd.DataFrame(boston.data)
boston_df.columns = columns
箱线图法
定量化箱线图,剔除离群值
help(pd.DataFrame.quantile)
Return values at the given quantile over requested aixs, a al numpy.percentile.
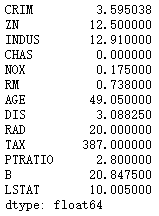
IQR
percentlier = boston_df.quantile([0, 0.25, 0.5, 0.75, 1], # 0-4
                               axis=0)    # 计算四分位值
IQR = percentlier.iloc[3] - percentlier.iloc[1]  # 四分位距 (0.75-0.25)
IQR
n < (Q1 - 1.5*IQR)
Q1 = percentlier.iloc[1] #第1四分位
Q3 = percentlier.iloc[3] #第3四分位
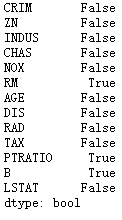
(boston_df < (Q1 - 1.5 * IQR)).any()
n > (Q3 + 1.5*IQR)
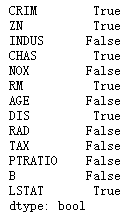
(boston_df > (Q3 + 1.5 * IQR)).any()
删除离群值
boston_df_out = boston_df[~((boston_df<(Q1-1.5*IQR)) |(boston_df>(Q3+1.5*IQR))).any(axis=1)]
print(boston_df.shape)
print(boston_df_out.shape)

正态分布法
依据正态分布统计理论,如果Z分数大于三个标准差,认为是离群值
help(stats.zscore)
Calculate the z score of each value in the sample, ralative to the sample mean and standard deviation.
计算Z分数
from scipy import stats #统计专用模块
import numpy as np
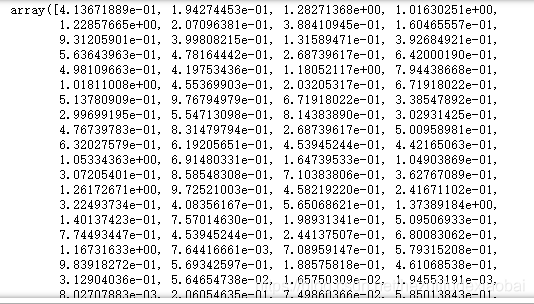
rm = boston_df['RM']
z = np.abs(stats.zscore(rm))
z
计算标准差
st = boston_df['RM'].std()
st
输出大于3个标准差的值的索引
threshold = 3 * st
print(np.where(z > threshold))
利用索引,得到小于三个标准差的值
rm_in = rm[(z < threshold)] # 保留所有Z分数绝对值小于三个标准差的数据
print(rm.shape)
print(rm_in.shape)


 1万+
1万+


 被折叠的 条评论
为什么被折叠?
被折叠的 条评论
为什么被折叠?
 到【灌水乐园】发言


