


分享一下我老师大神的人工智能教程!零基础,通俗易懂!http://blog.csdn.net/jiangjunshow
也欢迎大家转载本篇文章。分享知识,造福人民,实现我们中华民族伟大复兴!
Core Plot提供了散点图(CPScatterPlot)绘制,包括折线图和直方图,如下图所示:
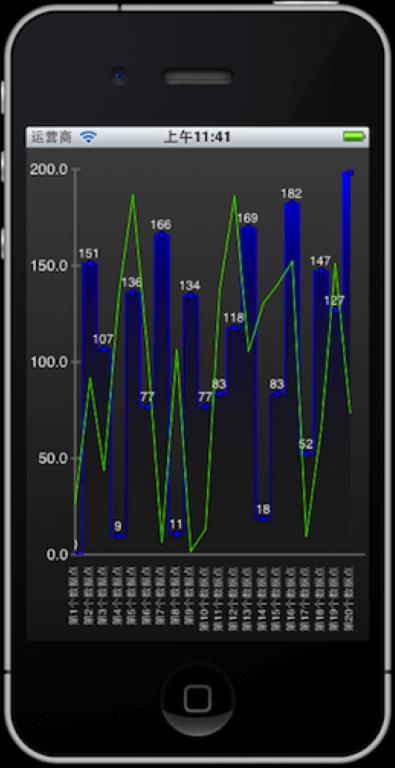
下面的代码包括了折线图和直方图的实现:
1、.h文件:
#import <UIKit/UIKit.h>
#import <CorePlot/CorePlot.h>
//散点图的数据点数:20
#definenum 20
@interfaceBarChartViewController : UIViewController <CPPlotDataSource>
{
@private
CPXYGraph *graph;
double x[num] ;//散点的x坐标
double y1[num] ;//第1个散点图的y坐标
double y2[num];//第2个散点图的y坐标
}
@end
2、.m文件:
#import "BarChartViewController.h"
@implementation BarChartViewController
-(BOOL)shouldAutorotateToInterfaceOrientation:(UIInterfaceOrientation)toInterfaceOrientation
{
return YES;
}
#pragma mark -
#pragma mark Initialization and teardown
-(void)viewDidAppear:(BOOL)animated
{
// 为CPGraph指定主题
graph = [[CPXYGraph alloc] initWithFrame:CGRectZero];
CPTheme *theme = [CPTheme themeNamed:kCPDarkGradientTheme];
[graph applyTheme:theme];
//把self.view由UIView转变为CPGraphHostingView,因为UIView无法加载CPGraph
self.view=[[ CPGraphHostingView alloc ]initWithFrame :[ UIScreen mainScreen]. bounds ];
CPGraphHostingView*hostingView = (CPGraphHostingView *)self.view;
[hostingView setHostedGraph :graph];
// CPGraph边框:无
graph.plotAreaFrame.borderLineStyle = nil;
graph.plotAreaFrame.cornerRadius = 0.0f;
//绘图空间 plotspace
CPXYPlotSpace *plotSpace= (CPXYPlotSpace *)graph.defaultPlotSpace;
//绘图空间大小:Y:0-300,x:0-16
plotSpace.yRange = [CPPlotRange plotRangeWithLocation:CPDecimalFromFloat(0.0f) length:CPDecimalFromFloat(200.0f)];
plotSpace.xRange = [CPPlotRange plotRangeWithLocation:CPDecimalFromFloat(0.0f) length:CPDecimalFromInt(num)];
// CPGraph四边不留白
graph.paddingLeft = 0.0f;
graph.paddingRight = 0.0f;
graph.paddingTop = 0.0f;
graph.paddingBottom = 0.0f;
//绘图区4边留白
graph.plotAreaFrame.paddingLeft = 45.0;
graph.plotAreaFrame.paddingTop = 40.0;
graph.plotAreaFrame.paddingRight = 5.0;
graph.plotAreaFrame.paddingBottom = 80.0;
//坐标系
CPXYAxisSet *axisSet =(CPXYAxisSet *)graph.axisSet;
//x轴:为坐标系的x轴
CPXYAxis *X =axisSet.xAxis;
//清除默认的轴标签,使用自定义的轴标签
X.labelingPolicy =CPAxisLabelingPolicyNone;
//构造MutableArray,用于存放自定义的轴标签
NSMutableArray*customLabels = [NSMutableArray arrayWithCapacity:num];
//构造一个TextStyle
static CPTextStyle*labelTextStyle=nil;
labelTextStyle=[[CPTextStyle alloc]init];
labelTextStyle.color=[CPColor whiteColor];
labelTextStyle.fontSize=10.0f;
//每个数据点一个轴标签
for (int i=0;i<num;i++) {
CPAxisLabel *newLabel =[[CPAxisLabel alloc] initWithText: [NSString stringWithFormat:@"第%d个数据点",(i+1)] textStyle:labelTextStyle];
newLabel.tickLocation = CPDecimalFromInt(i);
newLabel.offset = X.labelOffset + X.majorTickLength;
newLabel.rotation = M_PI/2;
[customLabelsaddObject:newLabel];
[newLabelrelease];
}
X.axisLabels = [NSSet setWithArray:customLabels];
//y轴
CPXYAxis *y =axisSet.yAxis;
//y轴:不显示小刻度线
y.minorTickLineStyle = nil;
//大刻度线间距:50单位
y.majorIntervalLength = CPDecimalFromString(@"50");
//坐标原点:0
y.orthogonalCoordinateDecimal = CPDecimalFromString(@"0");
y.titleOffset = 45.0f;
y.titleLocation = CPDecimalFromFloat(150.0f);
// 第1个散点图:蓝色
CPScatterPlot*boundLinePlot = [[[CPScatterPlot alloc] init] autorelease];
//id,用于识别该散点图
boundLinePlot.identifier = @"BluePlot";
//线型设置
CPLineStyle* lineStyle= [[[CPLineStyle alloc]init] autorelease];
lineStyle.lineWidth = 1.0f;
lineStyle.lineColor = [CPColor blueColor];
boundLinePlot.dataLineStyle =lineStyle;
//设置数据源,必须实现CPPlotDataSource协议
boundLinePlot.dataSource = self;
[graph addPlot:boundLinePlot];
// 在图形上添加一些小圆点符号(节点)
CPLineStyle*symbolLineStyle = [[CPLineStyle alloc ]init];
//描边:黑色
symbolLineStyle.lineColor = [CPColor blackColor];
//符号类型:椭圆
CPPlotSymbol *plotSymbol= [CPPlotSymbol ellipsePlotSymbol];
//填充色:蓝色
plotSymbol.fill = [CPFill fillWithColor:[CPColor blueColor]];
//描边
plotSymbol.lineStyle =symbolLineStyle;
//符号大小:10*10
plotSymbol.size = CGSizeMake(6.0, 6.0);
//向图形上加入符号
boundLinePlot.plotSymbol =plotSymbol;
// 创建渐变区
//渐变色1
CPColor *areaColor= [CPColor colorWithComponentRed:0.0 green:0.0 blue:1.0 alpha:1.0];
//创建一个颜色渐变:从 建变色1 渐变到 无色
CPGradient*areaGradient = [CPGradient gradientWithBeginningColor:areaColor endingColor:[CPColor clearColor]];
//渐变角度: -90度(顺时针旋转)
areaGradient.angle = -90.0f;
//创建一个颜色填充:以颜色渐变进行填充
CPFill*areaGradientFill = [CPFill fillWithGradient:areaGradient];
//为图形1设置渐变区
boundLinePlot.areaFill =areaGradientFill;
//渐变区起始值,小于这个值的图形区域不再填充渐变色
boundLinePlot.areaBaseValue = CPDecimalFromString(@"0.0");
//interpolation值为CPScatterPlotInterpolation枚举类型,该枚举有3个值:
//CPScatterPlotInterpolationLinear,线性插补——折线图.
//CPScatterPlotInterpolationStepped,在后方进行插补——直方图
//CPScatterPlotInterpolationHistogram,以散点为中心进行插补——直方图
boundLinePlot.interpolation = CPScatterPlotInterpolationHistogram;
// 第2个散点图:绿色
CPScatterPlot*dataSourceLinePlot = [[[CPScatterPlot alloc] init] autorelease];
dataSourceLinePlot.identifier = @"GreenPlot";
//线型设置
lineStyle = [[[CPLineStyle alloc]init] autorelease];
lineStyle.lineWidth = 1.0f;
lineStyle.lineColor = [CPColor greenColor];
dataSourceLinePlot.dataLineStyle =lineStyle;
//设置数据源,必须实现CPPlotDataSource协议
dataSourceLinePlot.dataSource = self;
[graph addPlot:dataSourceLinePlot];
//随机产生散点数据
NSUInteger i;
for ( i = 0; i < num; i++ ) {
x[i] = i ;
y1[i] = (num*10)*(rand()/(float)RAND_MAX);
y2[i] = (num*10)*(rand()/(float)RAND_MAX);
}
}
#pragmamark -
#pragmamark Plot Data Source Methods
//返回散点数
-(NSUInteger)numberOfRecordsForPlot:(CPPlot *)plot
{
return num ;
}
//根据参数返回数据(一个C数组)
- (double*)doublesForPlot:(CPPlot *)plot field:(NSUInteger)fieldEnumrecordIndexRange:(NSRange)indexRange
{
//返回类型:一个double指针(数组)
double *values;
NSString*identifier=(NSString*)[plot identifier];
switch (fieldEnum){
//如果请求的数据是散点x坐标,直接返回x坐标(两个图形是一样的),否则还要进一步判断是那个图形
case CPScatterPlotFieldX:
values=x;
break;
case CPScatterPlotFieldY:
//如果请求的数据是散点y坐标,则对于图形1,使用y1数组,对于图形2,使用y2数组
if([identifier isEqualToString:@"BluePlot"]) {
values=y1;
}else
values=y2;
break;
}
//数组指针右移个indexRage.location单位,则数组截去indexRage.location个元素
return values +indexRange.location ;
}
//添加数据标签
-(CPLayer*)dataLabelForPlot:(CPPlot *)plot recordIndex:(NSUInteger)index
{
//定义一个白色的TextStyle
static CPTextStyle *whiteText= nil;
if (!whiteText ) {
whiteText= [[CPTextStyle alloc] init];
whiteText.color = [CPColor whiteColor];
}
//定义一个TextLayer
CPTextLayer *newLayer =nil;
NSString*identifier=(NSString*)[plot identifier];
if([identifier isEqualToString:@"BluePlot"]) {
newLayer= [[[CPTextLayer alloc] initWithText:[NSString stringWithFormat:@"%.0f", y1[index]] style:whiteText] autorelease];
}
return newLayer;
}
@end
给我老师的人工智能教程打call!http://blog.csdn.net/jiangjunshow


 1154
1154

 被折叠的 条评论
为什么被折叠?
被折叠的 条评论
为什么被折叠?
 到【灌水乐园】发言


