


1.Matplotlib是python中非常有用的绘图库,与numpy结合得很好,同时Matplotlib也是独立的开源项目。
2.
# -----------------------------------------------------------------------------
# Copyright (c) 2015, Nicolas P. Rougier. All Rights Reserved.
# Distributed under the (new) BSD License. See LICENSE.txt for more info.
# -----------------------------------------------------------------------------
import numpy as np
import matplotlib.pyplot as plt
plt.figure(figsize=(8,5), dpi=80)
ax = plt.subplot(111)
ax.spines['right'].set_color('none')
ax.spines['top'].set_color('none')
ax.xaxis.set_ticks_position('bottom')
ax.spines['bottom'].set_position(('data',0))
ax.yaxis.set_ticks_position('left')
ax.spines['left'].set_position(('data',0))
X = np.linspace(-np.pi, np.pi, 256,endpoint=True)
C,S = np.cos(X), np.sin(X)
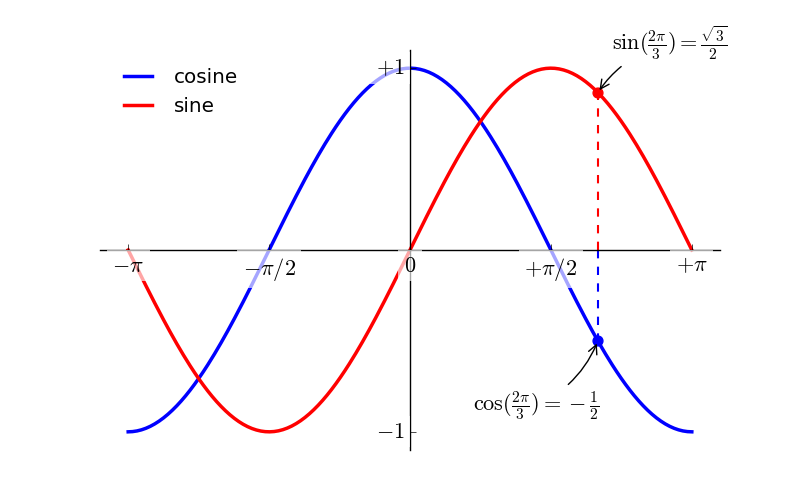
plt.plot(X, C, color="blue", linewidth=2.5, linestyle="-", label="cosine")
plt.plot(X, S, color="red", linewidth=2.5, linestyle="-", label="sine")
plt.xlim(X.min()*1.1, X.max()*1.1)
plt.xticks([-np.pi, -np.pi/2, 0, np.pi/2, np.pi],
[r'$-\pi$', r'$-\pi/2$', r'$0$', r'$+\pi/2$', r'$+\pi$'])
plt.ylim(C.min()*1.1,C.max()*1.1)
plt.yticks([-1, +1],
[r'$-1$', r'$+1$'])
plt.legend(loc='upper left', frameon=False)
t = 2*np.pi/3
plt.plot([t,t],[0,np.cos(t)],
color ='blue', linewidth=1.5, linestyle="--")
plt.scatter([t,],[np.cos(t),], 50, color ='blue')
plt.annotate(r'$\sin(\frac{2\pi}{3})=\frac{\sqrt{3}}{2}$',
xy=(t, np.sin(t)), xycoords='data',
xytext=(+10, +30), textcoords='offset points', fontsize=16,
arrowprops=dict(arrowstyle="->", connectionstyle="arc3,rad=.2"))
plt.plot([t,t],[0,np.sin(t)],
color ='red', linewidth=1.5, linestyle="--")
plt.scatter([t,],[np.sin(t),], 50, color ='red')
plt.annotate(r'$\cos(\frac{2\pi}{3})=-\frac{1}{2}$',
xy=(t, np.cos(t)), xycoords='data',
xytext=(-90, -50), textcoords='offset points', fontsize=16,
arrowprops=dict(arrowstyle="->", connectionstyle="arc3,rad=.2"))
for label in ax.get_xticklabels() + ax.get_yticklabels():
label.set_fontsize(16)
label.set_bbox(dict(facecolor='white', edgecolor='None', alpha=0.65 ))
plt.savefig("../figures/exercice_10.png",dpi=72)
plt.show()


 被折叠的 条评论
为什么被折叠?
被折叠的 条评论
为什么被折叠?
 到【灌水乐园】发言


