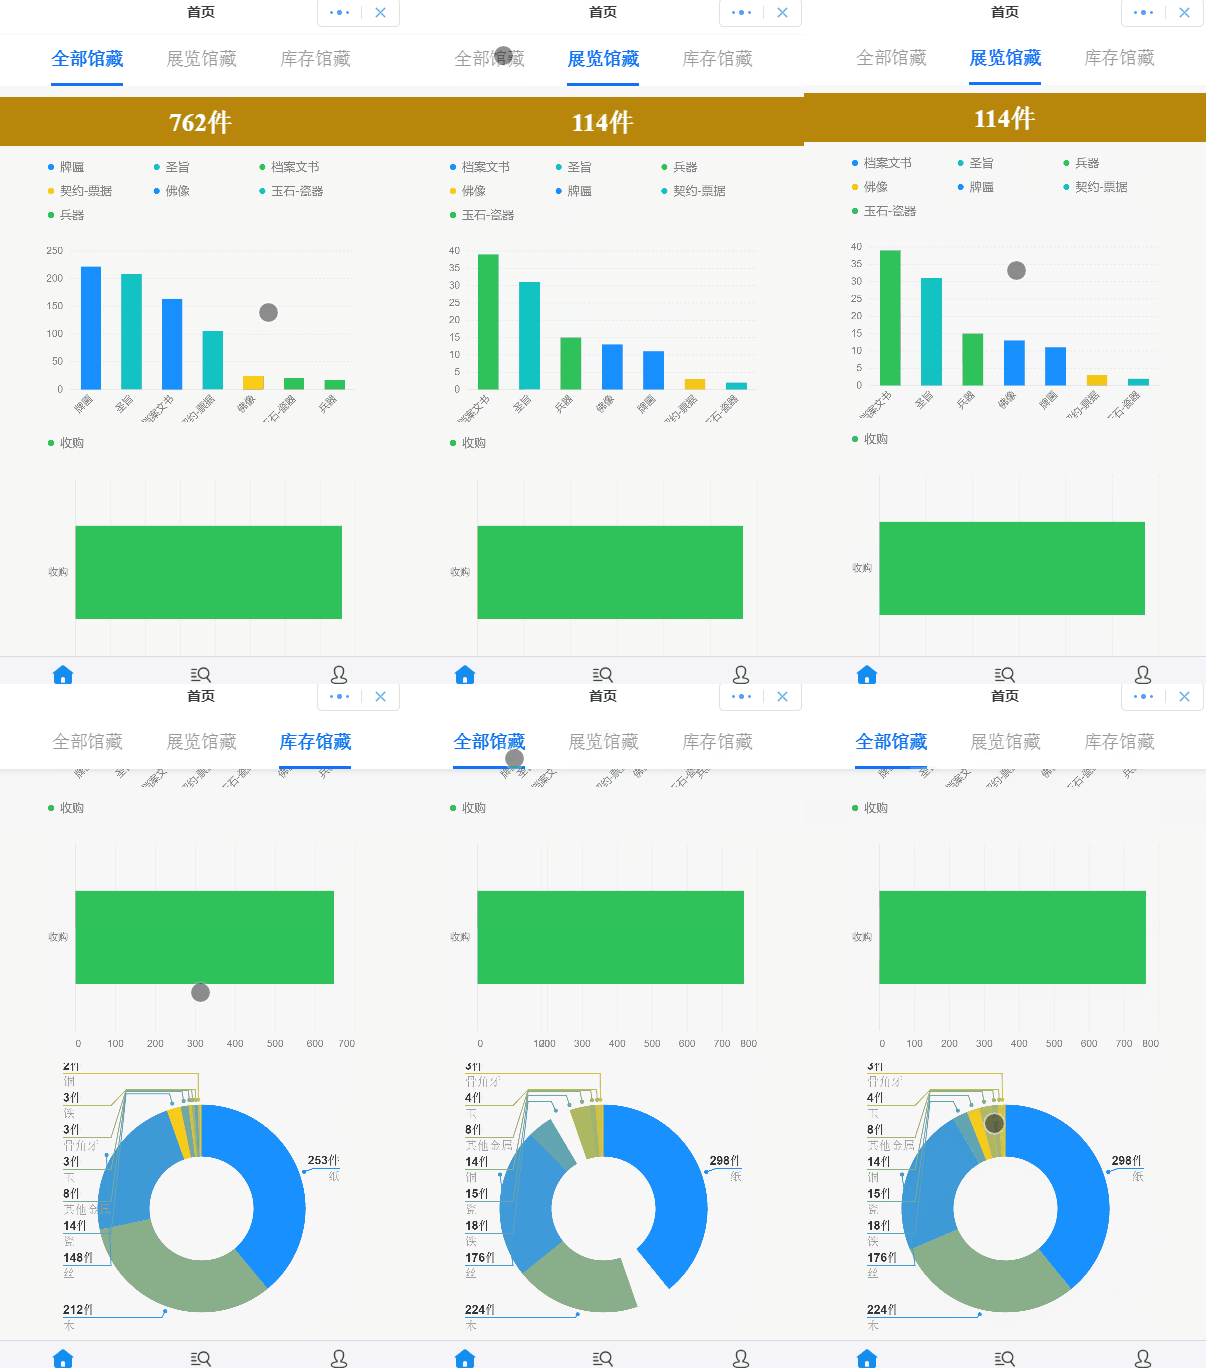
公司有项目拟在钉钉小程序中实现部分功能,其中需要图表展示,经过与echart的比较,最终选择了阿里系的 F2,f2宣传的是“专注于移动,兼容多种环境(Node, 小程序,Weex)”,且有相关支持的文档,没有看到echart对阿里系的小程序支撑。
先上效果图:

钉钉小程序引入F2
首先钉钉小程序如何引入F2图表,点击这里,参考支付宝的内容即可。
f2官方文档点这里
新手建议直接用 npm install @antv/my-f2 的方式引入,不要研究js引入,以及插件化的引入。
一个页面多个图表
我这个程序需要一个页面里有多个图表展示,那么就需要多个 canvas 进行渲染。
图表数据自动刷新
同时,还有需求是点击页签后,图表数据需要刷新,一开始想的是一个页签对应一套图表,页签变化,对应的图表就展示出来,越想这种方式越low,查了半天文档,发现f2 有 chart.changeData(data) 这个方法,马上就上手试一试。问题又来了,点击事件后,如何获取chart 对象,毕竟小程序不像 HTML那么容易通过document进行DOM操作。晚上睡了一觉,第二天突然就想到了全局变量的方式,页面图表init的时候,就把chart 对象赋值给全局对象,页签变动后,直接操作chart对象即可,而且官方API中 chart的所有方法都能用了。
下面直接上代码
页面代码
<!--页签-->
<view class="tabs {{shadow ? 'shadow' : ''}}" style="top: 0px">
  <view class="tabs-bar">
    <block a:for="{{tabs}}">
    </block>
  </view>
</view>
<!--多个图表区-->
<view class="container">
  <canvas id="column" onTouchStart="touchStart1" onTouchMove="touchMove1" onTouchEnd="touchEnd1" width="{{width1}}" height="{{height1}}" />
</view>
<view class="container">
  <canvas id="pie"  onTouchStart="touchStart2" onTouchMove="touchMove2" onTouchEnd="touchEnd2" width="{{width2}}" height="{{height2}}" />
</view>
<view class="container">
  <canvas id="mountNode"  width="{{width3}}" height="{{height3}}" onTouchStart="touchStart3" onTouchMove="touchMove3" onTouchEnd="touchEnd3"/>
</view>
JS
import F2 from '@antv/my-f2';
let app = getApp();
let url = app.globalData.url;
// 图表的全局变量
let chart1 = null;
let chart2 = null;
let chart3 = null;

let  data12 = [
    { year: '圣', sales: 100 },
    { year: '牌', sales: 10 },
  ];
let  data11 = [
    { year: '圣', sales: 138 },
    { year: '牌', sales: 102 },
  ];
let data10 = [
    { year: '圣', sales: 238 },
    { year: '牌', sales: 152 },
  ];
let data20 = [
    { country: '明', population: 1314 },
    { country: '清', population: 2022 },
  ];
  let data21 = [
    { country: '明', population: 1014 },
    { country: '清', population: 1022 },
  ];
  let data22 = [
    { country: '明', population: 14 },
    { country: '清', population: 122 },
  ];
function drawChart11(canvas, width, height) {
  chart1 = new F2.Chart({ el: canvas, width, height });
  chart1.source(data10, { sales: { tickCount: 5 } });
  chart1.tooltip({
    showItemMarker: false,
    onShow: function (ev) {
      var items = ev.items;
      items[0].name = null;
      items[0].name = items[0].title;
      items[0].value = items[0].value;
    }
  });
  chart1.axis('year', {
    label: {
      rotate: -Math.PI / 4,
      textAlign: 'end',
      textBaseline: 'middle'
    }
  });
  chart1.interval().position('year*sales');
  chart1.render();
};

function drawChart22(canvas, width, height) {
  var Global = F2.Global;
  chart2 = new F2.Chart({ el: canvas, width, height });

  chart2.source(data20, {
    population: {
      tickCount: 5
    }
  });
  chart2.coord({
    transposed: true
  });
  chart2.tooltip({
    showItemMarker: false,
    onShow: function (ev) {
      var items = ev.items;
      items[0].name = null;
      items[0].name = items[0].title;
      items[0].value = items[0].value;
    }
  });
  chart2.axis('country', {
    line: Global._defaultAxis.line,
    grid: null
  });
  chart2.axis('population', {
    line: null,
    grid: Global._defaultAxis.grid,
    label: function (text, index, total) {
      var textCfg = {};
      if (index === 0) {
        textCfg.textAlign = 'left';
      } else if (index === total - 1) {
        textCfg.textAlign = 'right';
      }
      return textCfg;
    }
  });
  chart2.interval().position('country*population');
  chart2.render();
  return chart2;
}
function drawChart33(canvas, width, height) {
  var data = [{
    const: 'const',
    type: '圣旨',
    money: 51.39
  }, {
    const: 'const',
    type: '牌匾',
    money: 356.68
  }, {
    const: 'const',
    type: '兵器',
    money: 20.00
  }, {
    const: 'const',
    type: '钱币',
    money: 116.53
  }];
  chart3 = new F2.Chart({ el: canvas, width, height });
  chart3.source(data);
  chart3.coord('polar', {
    transposed: true,
    radius: 0.9,
    innerRadius: 0.5
  });
  chart3.axis(false);
  chart3.legend(false);
  chart3.tooltip(false);
  chart3.interval().position('const*money').adjust('stack').color('type', ['#1890FF', '#13C2C2', '#2FC25B', '#FACC14']);
  chart3.pieLabel({
    sidePadding: 30,
    activeShape: true,
    label1: function label1(data) {
      return {
        text: data.money,
        fill: '#343434',
        fontWeight: 'bold'
      };
    },
    label2: function label2(data) {
      return {
        text: data.type,
        fill: '#999'
      };
    }
  });
  chart3.render();
  return chart3;
}
Page({
  data: {
    top: 0,
    tabs: ['全部馆藏', '展览馆藏', '库存馆藏'],
    activeTab: 0,
    titleOpacity: 1,
    listHidden: false,
    emptyHidden: true,
  },
  //标签点击事件,图表数据更新展示
  onTabBarTap(e) {
    const { index } = e.target.dataset;
    var totalCount = 0;
    if (index == 0) {
      totalCount = 5999;
      chart1.changeData(data10);
      chart2.changeData(data20);
    } else if (index == 1) {
      totalCount = 2999;
      chart1.changeData(data11);
      chart2.changeData(data21);
    } else if (index == 2) {
      totalCount = 3000;
      chart1.changeData(data12);
      chart2.changeData(data22);
    }
    this.setData({
      activeTab: index,
      totalCount: totalCount
    });
  },
  initChart1() {
    dd.createSelectorQuery()
      .select('#column')
      .boundingClientRect()
      .exec((res) => {
        // 获取分辨率
        const pixelRatio = dd.getSystemInfoSync().pixelRatio;
        // 获取画布实际宽高
        const canvasWidth = res[0].width;
        const canvasHeight = res[0].height;
        this.setData({
          width1: canvasWidth * pixelRatio,
          height1: canvasHeight * pixelRatio
        }, () => {
          const myCtx = dd.createCanvasContext('column');
          myCtx.scale(pixelRatio, pixelRatio); // 必要!按照设置的分辨率进行放大
          const canvas = new F2.Renderer(myCtx);
          this.canvas1 = canvas;
          drawChart11(canvas, res[0].width, res[0].height);
        });
      });
  },
  initChart2() {
    dd.createSelectorQuery()
      .select('#pie')
      .boundingClientRect()
      .exec((res) => {
        // 获取分辨率
        const pixelRatio = my.getSystemInfoSync().pixelRatio;
        // 获取画布实际宽高
        const canvasWidth = res[0].width;
        const canvasHeight = res[0].height;
        this.setData({
          width2: canvasWidth * pixelRatio,
          height2: canvasHeight * pixelRatio
        }, () => {
          const myCtx = my.createCanvasContext('pie');
          myCtx.scale(pixelRatio, pixelRatio); // 必要!按照设置的分辨率进行放大
          const canvas = new F2.Renderer(myCtx);
          this.canvas2 = canvas;
          drawChart22(canvas, res[0].width, res[0].height);
        });

      });
  },
  initChart3() {
    dd.createSelectorQuery()
      .select('#mountNode')
      .boundingClientRect()
      .exec((res) => {
        // 获取分辨率
        const pixelRatio = my.getSystemInfoSync().pixelRatio;
        // 获取画布实际宽高
        const canvasWidth = res[0].width;
        const canvasHeight = res[0].height;
        this.setData({
          width3: canvasWidth * pixelRatio,
          height3: canvasHeight * pixelRatio
        }, () => {
          const myCtx = my.createCanvasContext('mountNode');
          myCtx.scale(pixelRatio, pixelRatio); // 必要!按照设置的分辨率进行放大
          const canvas = new F2.Renderer(myCtx);
          this.canvas3 = canvas;
          drawChart33(canvas, res[0].width, res[0].height);
        });

      });
  },
  onLoad() {
    let _this = this;
  },
  onReady() {
    this.initChart1();
    this.initChart2();
    this.initChart3();
  },
  touchStart1(e) { if (this.canvas1) { this.canvas1.emitEvent('touchstart', [e]); } },
  touchMove1(e) { if (this.canvas1) { this.canvas1.emitEvent('touchmove', [e]); } },
  touchEnd1(e) { if (this.canvas1) { this.canvas1.emitEvent('touchend', [e]); } },
  touchStart2(e) { if (this.canvas2) { this.canvas2.emitEvent('touchstart', [e]); } },
  touchMove2(e) { if (this.canvas2) { this.canvas2.emitEvent('touchmove', [e]); } },
  touchEnd2(e) { if (this.canvas2) { this.canvas2.emitEvent('touchend', [e]); } },
  touchStart3(e) { if (this.canvas3) { this.canvas3.emitEvent('touchstart', [e]); } },
  touchMove3(e) { if (this.canvas3) { this.canvas3.emitEvent('touchmove', [e]); } },
  touchEnd3(e) { if (this.canvas3) { this.canvas3.emitEvent('touchend', [e]); } },
})
如果对你有帮助,点个赞哦。
如需引用,注明出处!


 182
182

 被折叠的 条评论
为什么被折叠?


