


1.prometheus接入springboot
prometheus安装后,在安装目录有一个默认的配置文件prometheus.yml
# my global config
global:
  scrape_interval: 15s # Set the scrape interval to every 15 seconds. Default is every 1 minute.
  evaluation_interval: 15s # Evaluate rules every 15 seconds. The default is every 1 minute.
  # scrape_timeout is set to the global default (10s).

# Alertmanager configuration
alerting:
  alertmanagers:
    - static_configs:
        - targets:
          # - alertmanager:9093

# Load rules once and periodically evaluate them according to the global 'evaluation_interval'.
rule_files:
  # - "first_rules.yml"
  # - "second_rules.yml"

# A scrape configuration containing exactly one endpoint to scrape:
# Here it's Prometheus itself.
scrape_configs:
  # The job name is added as a label `job=<job_name>` to any timeseries scraped from this config.
  - job_name: "prometheus"

    # metrics_path defaults to '/metrics'
    # scheme defaults to 'http'.

    static_configs:
      - targets: ["localhost:9090"]
默认配置了一个job_name,监控prometheus本身。需要增加一个监控springboot项目
- job_name: "custom_spring_boot"
    metrics_path: '/actuator/prometheus'
    static_configs:
      - targets: ["localhost:9595"]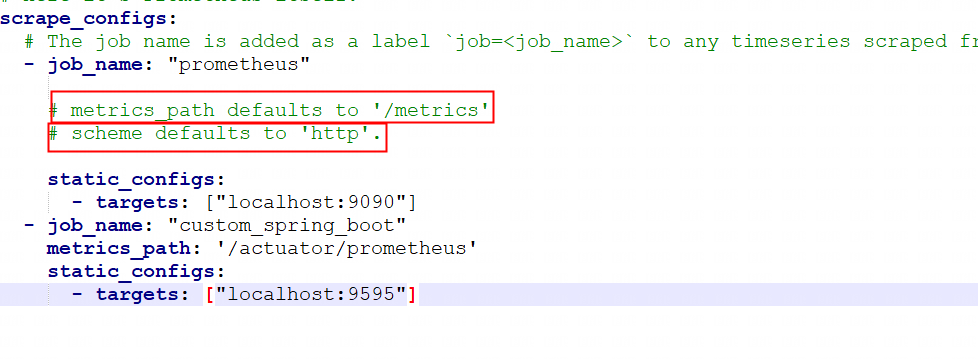
metrics_path 默认采集metrics的路径是
/metrics;需要改成/actuator/prometheusscheme 默认是http;如果是https需要自定义配置
targets 获取metrics的地址和端口列表
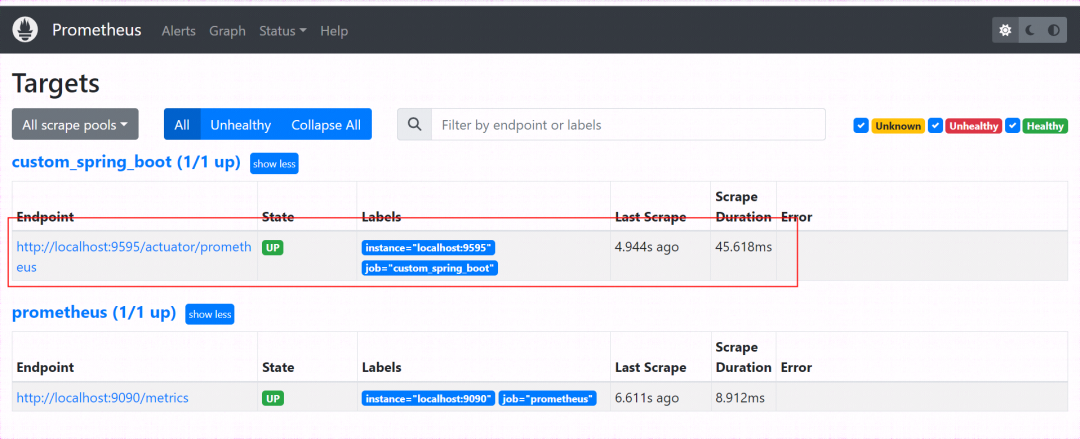
2.访问prometheus
http://127.0.0.1:9090/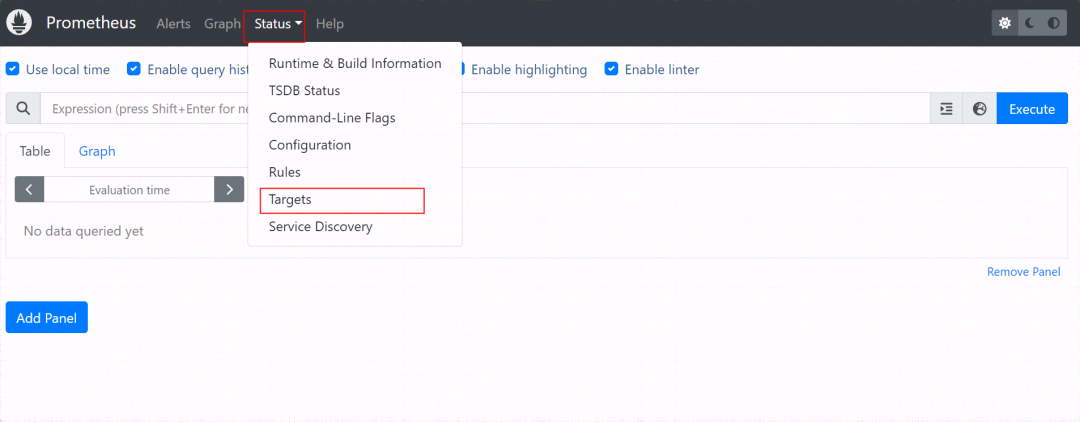
出现自定义需要监控的springboot端点列表
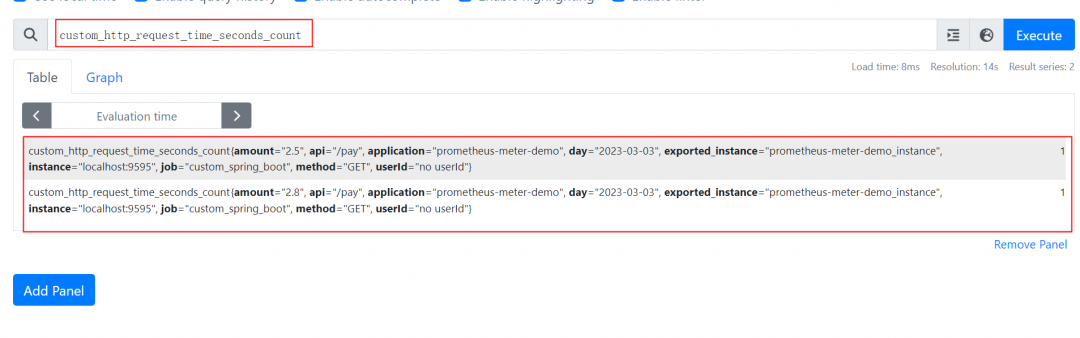
在首页,可以查询各种不同的指标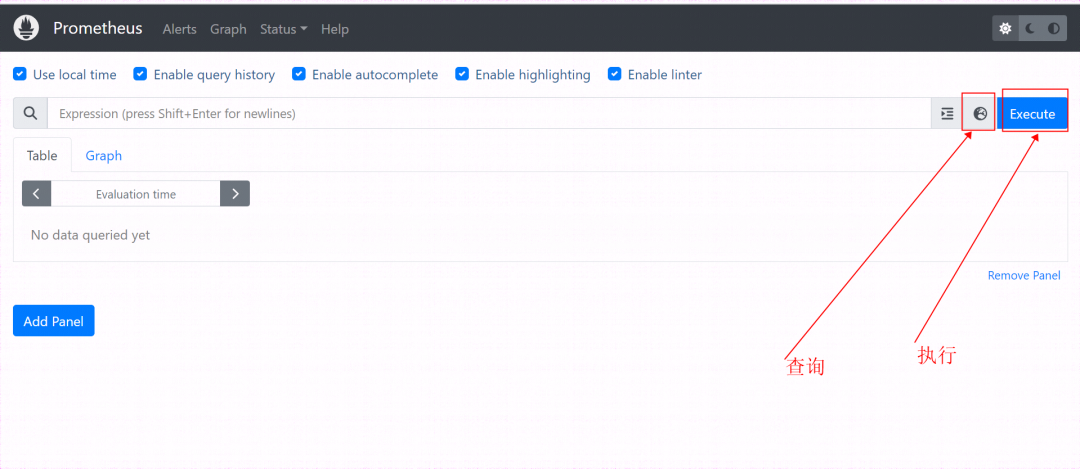
比如查询custom_http_request_time_seconds_count指标
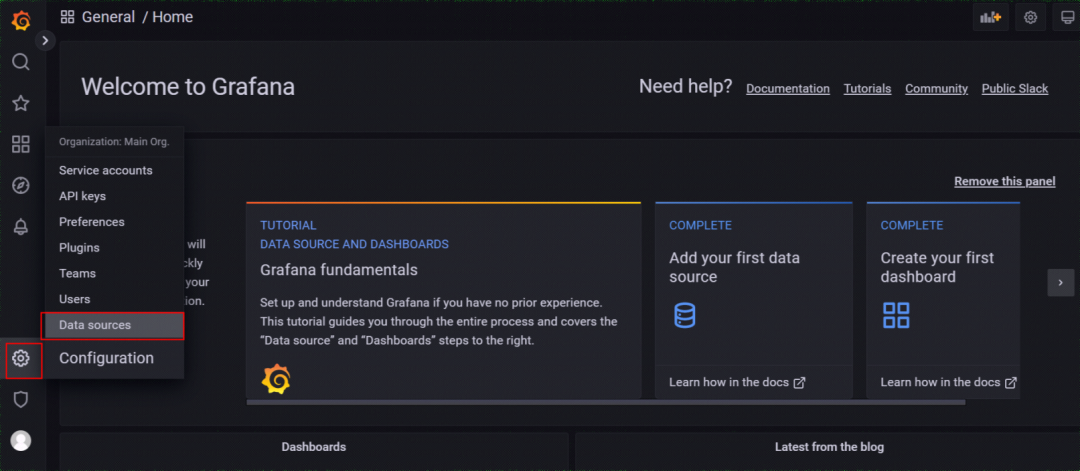
3.grafana接入prometheus
访问
http://127.0.0.1:3000/配置数据源
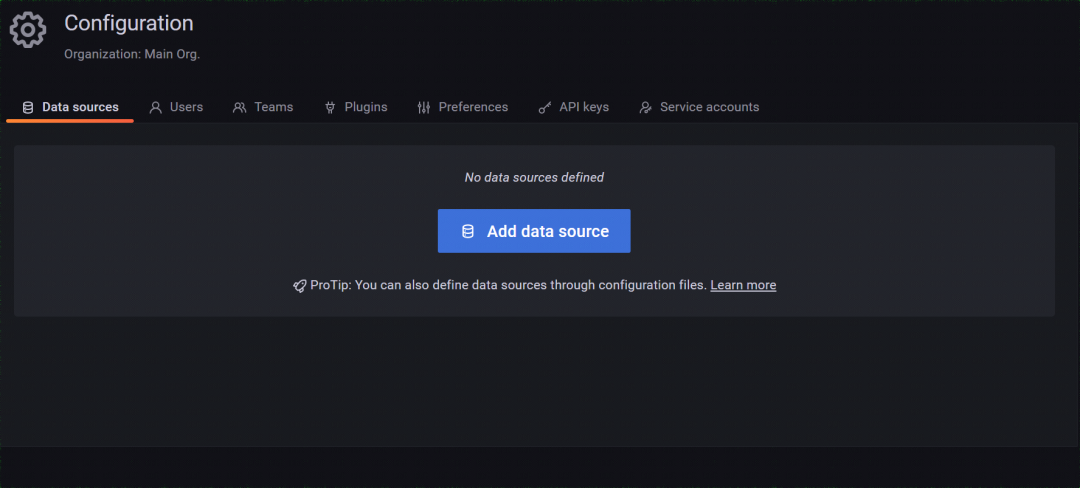
添加一个数据
选择prometheus
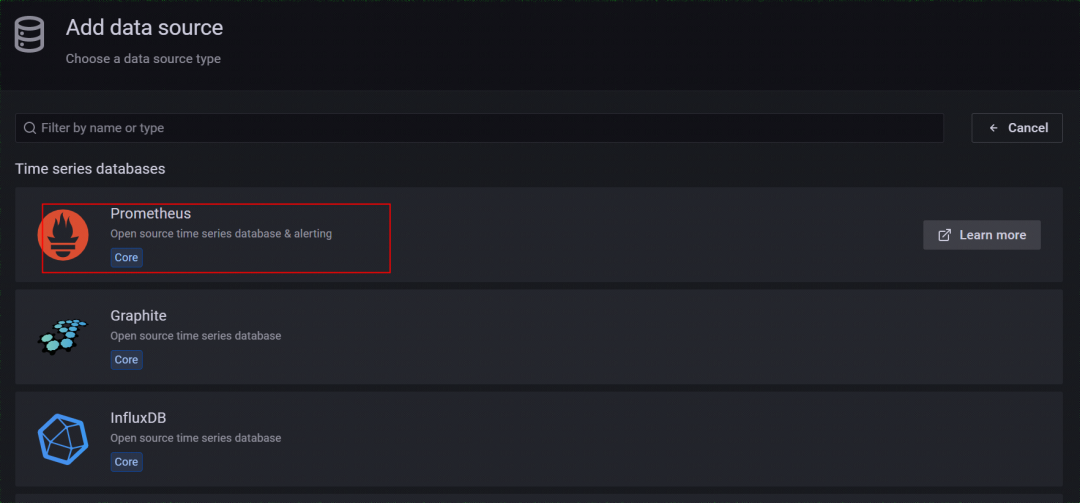
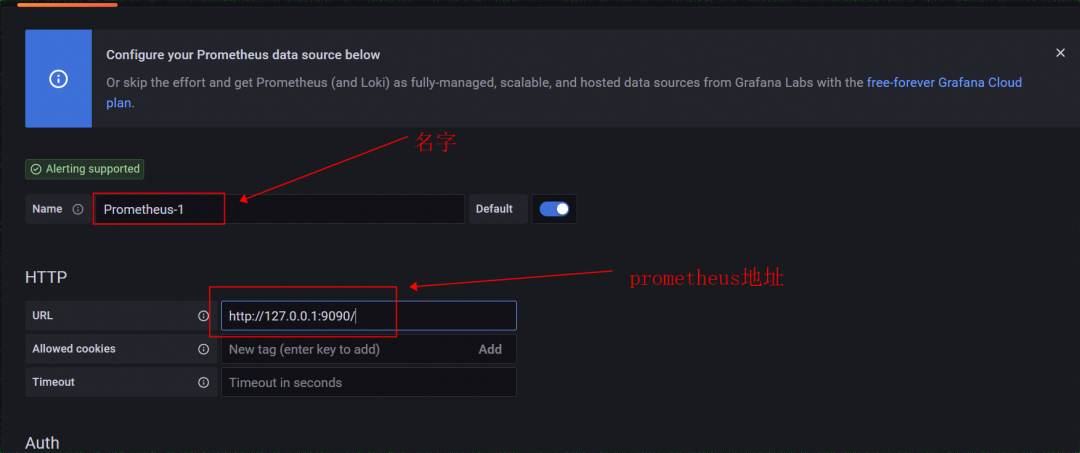
设置名称和prometheus服务地址
4.配置仪表盘
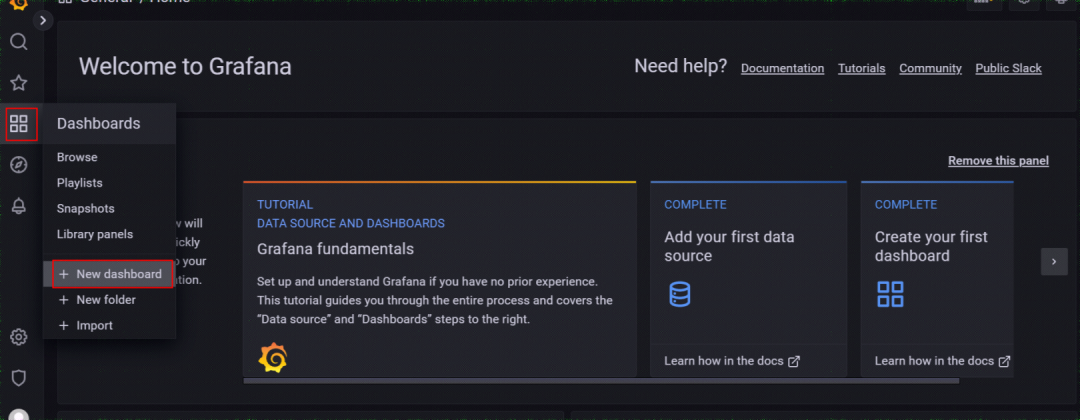
点击Add a new panel;新建一个Panel
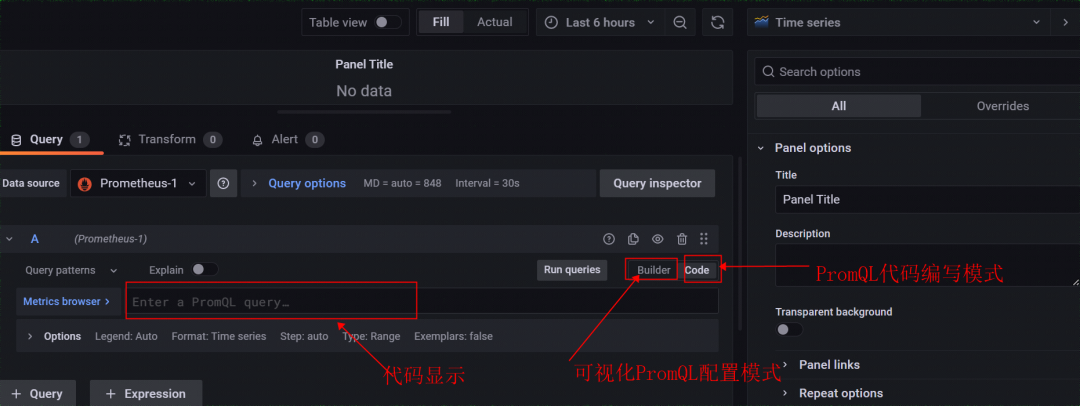
平均时间查询
sum by(api) (rate(custom_http_request_time_seconds_count{job="custom_spring_boot", api="/order"}[5m]))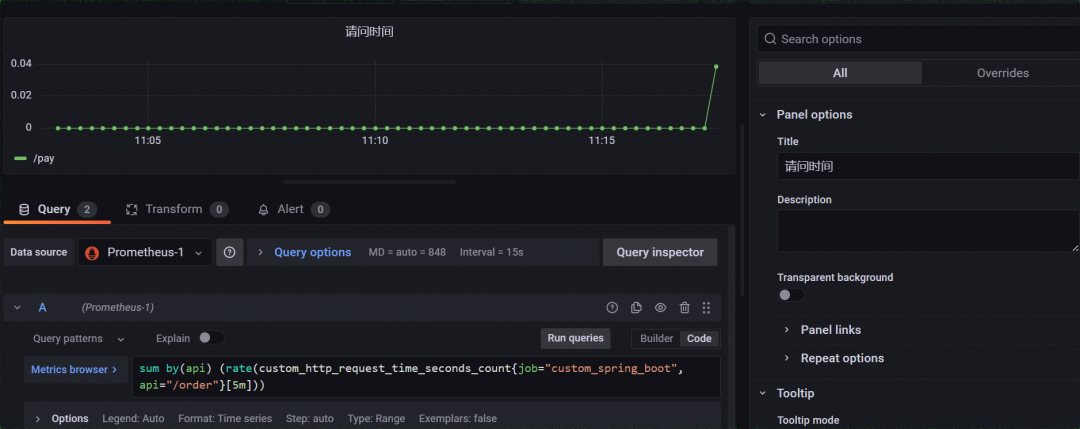
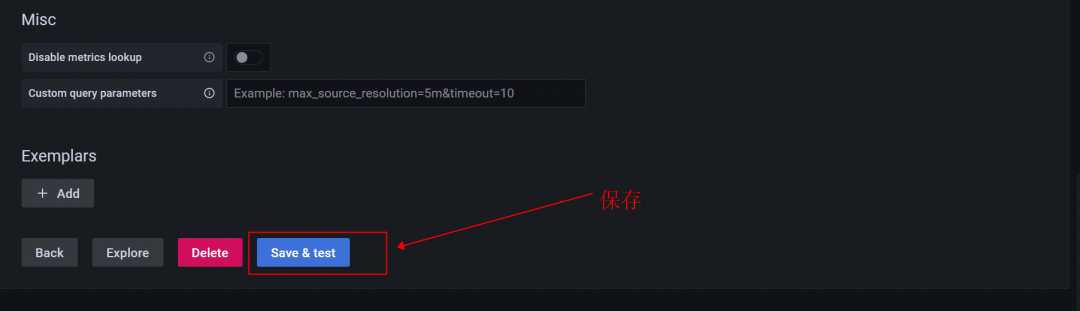
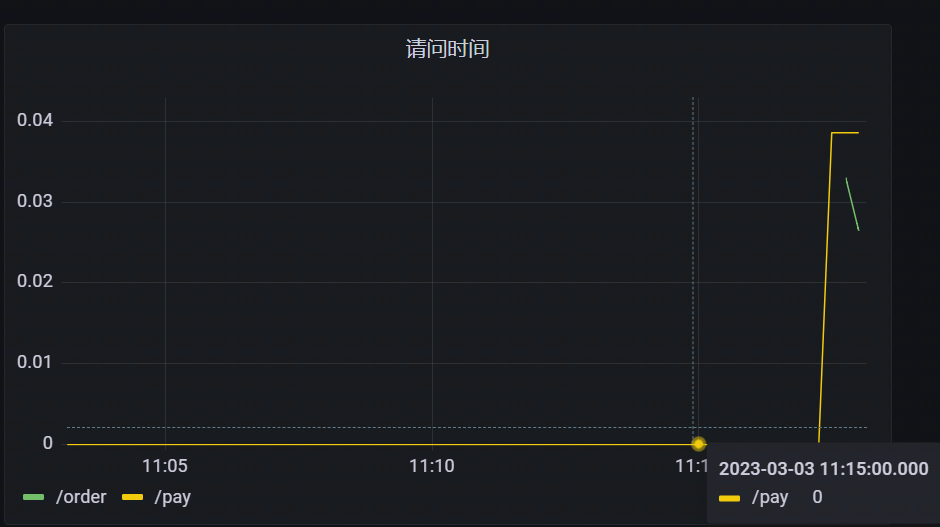
保存,最终显示


 6129
6129


 被折叠的 条评论
为什么被折叠?
被折叠的 条评论
为什么被折叠?
 到【灌水乐园】发言


