


***********************************************声明***********************************************************************
原创作品,出自 “深蓝的blog” 博客,欢迎转载,转载时请务必注明出处,否则追究版权法律责任。
深蓝的blog:http://blog.csdn.net/huangyanlong/article/details/39803995
****************************************************************************************************************************
蓝的成长记——追逐DBA(8):重拾SP报告,回忆oracle的STATSPACK实验
**************************************************简介********************************************************************
个人在oracle路上的成长记录,其中以蓝自喻,分享成长中的情感、眼界与技术的变化与成长。敏感信息均以英文形式代替,不会泄露任何企业机密,纯为技术分享。
创作灵感源于对自己的自省和记录。若能对刚刚起步的库友起到些许的帮助或共鸣,欣慰不已。
欢迎拍砖,如有关技术细节表述有错误之处,请您留言或邮件([email protected])指明,不胜感激。
***************************************************************************************************************************
今天有些慵懒,整理过往学习中的一个实验,忆起oracle的SP报告。
——深蓝
**************************************************前言********************************************************************
这是一部个人记录的成长杂记,既然步入到oracle的这片蓝海,免不了一路的奔波与不断的考验。借由此杂记与库友们分享蓝的成长历程。
不知何时起对蓝有了一种说不出来的痴迷,痴迷其广博,痴迷其深邃,痴迷于近在咫尺却又遥不可及。
而又说不清从何时起,注视于oracle的红色耀眼,照亮出眼前的一道光,未知与迷惑在自己的脚下开始初露些许人生的充实与青春的回馈。
在追逐于DBA梦想的道路上步步前行。
***************************************************************************************************************************
时间有些久了,有些淡忘了SP报告的方法了,今天就利用闲暇的时光,重新拾起熟悉又陌生的STATSPACK报告的实验。
实验计划:
1、模拟某业务环境,制定快照计划;
2、生成初始状态数据库的statspack报告,分析数据;
3、调整数据缓冲区尺寸,生成 statspack报告,分析数据;
4、创建索引,生成statspack报告,分析数据;
5、使用绑定变量,生成 statspack报告,分析数据。
******************************************************************************************
步骤一:模拟业务环境,制定快照计划
目标:
1、关闭sga自动管理,调整DB cache、sharepool大小;
2、部署statspack;
3、部署模拟现场环境;
*****************************************************************************************
1、关闭sga自动管理,调整DB cache、sharepool大小,模拟现场环境
SQL> alter system set memory_target=0 scope=spfile;        --11g中关闭内存自动管理
SQL> alter system set sga_target=0;
SQL> alter system set db_cache_size=30m scope=spfile;      --修改DB cache大小
SQL> alter system set shared_pool_size=70m scope=spfile;   --修改share pool大小
SQL> startup force;                                        --重启数据库
SQL> select component,current_size/1024/1024 from v$sga_dynamic_components;  --查询修改后的缓冲区大小
COMPONENT                                          CURRENT_SIZE/1024/1024
----------------------------------------           ----------------------
shared pool                                                             72
DEFAULT buffer cache                                                    32
2、部署statspack
SQL> create tablespace tools datafile '/u01/app/oracle/oradata/PROD/disk6/tools01.dbf' size 300m;  --创建statspack专用的tools表空间
SQL> @?/rdbms/admin/spcreate.sql  --以sysdba身份执行spcreate脚本,用于创建spcreate对象
输入值设置:
Enter value for perfstat_password: oracle
Enter value for default_tablespace: tools
Enter value for temporary_tablespace:回车
$ vi /u01/app/oracle/product/11.2.0/db_1/rdbms/admin/spauto.sql  --设置自动快照时间,间隔30分钟生成一次快照
编辑如下:
begin
  select instance_number into :instno from v$instance;
  dbms_job.submit(:jobno, 'statspack.snap;', trunc(sysdate+1/48,'MI'), 'trunc(SYSDATE+1/48,''MI'')', TRUE, :instno);
  commit;
end;
SQL>exec statspack.modify_statspack_parameter(i_snap_level=>7);  --设置快照默认级别为7
SQL> conn scott/tiger
SQL>CREATE SEQUENCE emp2_empno
  	INCREMENT BY 1
  	START WITH 1
  	MAXVALUE 100000000
  	CACHE 10000
  	NOCYCLE;  --执行创建序列语句
3、部署模拟现场环境
SQL> create table emp2 as select * from emp where 1=2; --创建实验表emp2,结构同emp表
SQL> alter table emp2 modify empno number(10);
SQL> alter table emp2 modify ename varchar(30);
SQL> alter table emp2 nologging; --为加快数据插入速度,关闭日志记录
--插入2千万行数据
SQL>begin
     for i in 1..20000000 loop
       insert into emp2
       values (emp2_empno.nextval,'cuug'||i,'SALESMAN',7698,sysdate,1600,300,30);
       if mod(i,1000)=0 then
       commit;
       end if;
    end loop;
    commit;
end;
/
SQL> alter table emp2 logging; --开启日志记录
$ vi script/bin/share_pool_sql_1.sh --编写查询的业务脚本
#!/bin/bash

CNT=1
while [ $CNT -lt 20000000 ]
do
sqlplus scott/tiger <<EOF
select * from emp2 where empno=$CNT;
exit
EOF
CNT=`expr $CNT + 1`
done
$ sh script/bin/share_pool_sql_1.sh  --执行脚本,模拟“查询业务”
*****************************************************************************************
步骤二:生成原始statspack报告,分析报告
目标:
1、开启自动快照;
2、生成、导出报告;
3、关闭job;
4、分析报告。
*****************************************************************************************
1、开启自动快照
<span style="font-size:12px;">SQL> conn perfstat/oracle    --开启快照及查询相关业务时,需要以perfstat身份登录
SQL>@?/rdbms/admin/spauto    --执行脚本,开启自动快照</span>
<span style="font-size:12px;">SQL> conn perfstat/oracle --开启快照及查询相关业务时,需要以perfstat身份登录
SQL>@?/rdbms/admin/spauto --执行脚本,开启自动快照</span>2、生成报告
SQL> alter session set nls_date_format='yyyy-mm-dd hh24:mi:ss';  --设置查看格式,便于查询
SQL> select snap_id,snap_time,snap_level from stats$snapshot order by snap_time; --查询快照数量,是否满足生成statspack报告条件
SQL> @?/rdbms/admin/spreport  --生成statspack报告
手工设置:
Enter value for begin_snap:快照起点
Enter value for end_snap: 快照终点
Enter value for report_name:默认或指定报告名称
--使用x-manager将报告拷贝到windows主机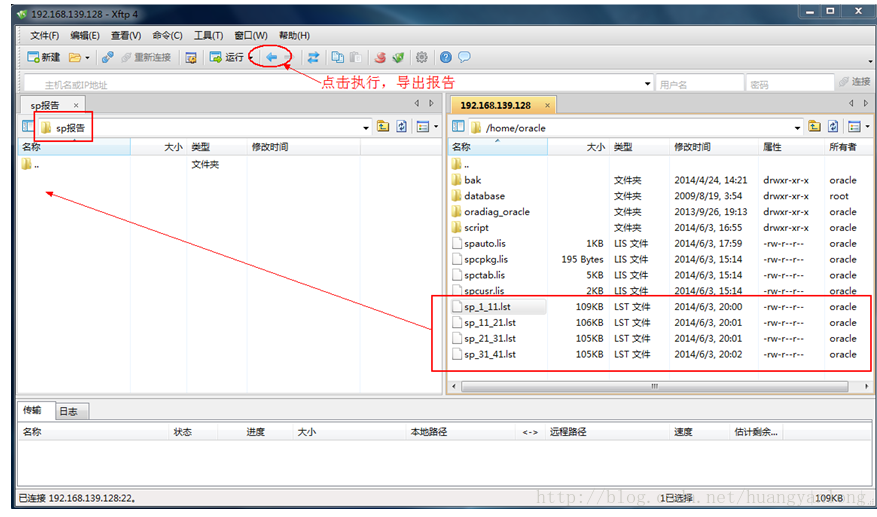
3、关闭job
SQL> select job,log_user,last_date,next_date from user_jobs;  --查询需要关闭的job号
SQL> exec dbms_job.remove('21');                       --将job号为21的任务删除
4、分析报告
关注点:
①buffer hit
②library hit
③Top 5 Timed Events
④造成最大物理读的sql
⑤Buffer Pool Advisory
⑥time model system stats
⑦Latch Sleep breakdown
① buffer hit、②library hit
| 时间 |
Buffer Hit(%) |
Library Hit(%) |
| 17:42:01~ 18:12:00 |
99.76 |
86.56 |
| 18:12:00 ~ 18:42:00 |
99.87 |
86.55 |
| 18:42:00~ 19:12:05 |
99.74 |
86.55 |
| 19:12:05~ 19:42:03 |
99.86 |
86.90 |
| avg |
99.81 |
86.64 |
分析:
buffer hit高于95%符合数据正常性能标准。library hit低于95%,说明库缓存区命中率较低,需做相应调整。
③Top 5 Timed Events
| 时间 |
name |
waits |
Time (s) |
| 17:42:01~ 18:12:00 |
direct path read |
32,014,645 |
814 |
| db file sequential read |
1,697 |
6 |
|
| log file parallel write |
706 |
5 |
|
| 18:12:00 ~18:42:00 |
direct path read |
32,095,337 |
816 |
| log file parallel write |
898 |
5 |
|
| os thread startup |
50 |
9 |
|
| 18:42:00~ 19:12:05 |
direct path read |
32,438,303 |
816 |
| log file parallel write |
816 |
7 |
|
| control file parallel write |
493 |
1 |
|
| 19:12:05~ 19:42:03 |
direct path read |
32,255,547 |
816 |
| log file parallel write |
716 |
5 |
|
| control file parallel write |
491 |
1 |
分析:
    direct path read的磁盘I/O产生量最大,db file sequential read、log file parallel write、control file parallel write也会产生部分磁盘I/O。
④查出造成物理读最大的前几个sql语句,产生执行计划
SQL>select sql_text from v$sql where disk_reads=(select max(disk_reads) from v$sql);  --查询造成最大物理读的sql语句
……
select * from emp2 where empno=2215
select * from emp2 where empno=2270
select * from emp2 where empno=2208
……
SQL> set autotrace on;
SQL> set timing on;
SQL> select * from emp2 where empno=2208;  --执行一条语句,查看执行计划,可以发现方式为全表扫描,在oracle11g下全表扫描时,库缓冲区将直接从磁盘中查询数据,磁盘I/O较大。cost值、physical read较大
<span style="font-family:SimSun;font-size:12px;">   EMPNO     ENAME        JOB           MGR  HIREDATE     SAL   COMM  DEPTNO
------------ ---------------------   ------------------  ----------  -----------     ---------- ------------  --------------
      2208       cuug2207     SALESMAN    7698  03-JUN-14       1600     300        30
</span>Elapsed: 00:00:00.94
Execution Plan
----------------------------------------------------------
Plan hash value: 2941272003
--------------------------------------------------------------------------
| Id  | Operation         | Name | Rows  | Bytes | Cost (%CPU)| Time     |
--------------------------------------------------------------------------
|   0 | SELECT STATEMENT  |      |     1 |    48 | 40046   (1)| 00:08:01 |
|*  1 |  TABLE ACCESS FULL| EMP2 |     1 |    48 | 40046   (1)| 00:08:01 |
--------------------------------------------------------------------------
Statistics
----------------------------------------------------------
          0  recursive calls
          0  db block gets
     147357  consistent gets
     147349  physical reads
          0  redo size
        869  bytes sent via SQL*Net to client
        419  bytes received via SQL*Net from client
          2  SQL*Net roundtrips to/from client
          0  sorts (memory)
          0  sorts (disk)
          1  rows processed
分析:
未发现造成物理读最大的sql。但发现查询语句为全表扫描,每条语句物理读都相对较大。
⑤Buffer Pool Advisory
| statistics |
||||||||
| Time |
P |
Size for Est (M) |
Size Factr |
Buffers (thousands) |
Est Phys Read Factr |
Estimated Phys Reads (thousands) |
Est Phys Read Time
|
Est % dbtime for Rds
|
| 17:42:01~ 18:12:00 |
D |
32 |
1.0 |
4 |
1.0 |
17 |
15 |
.3 |
| 18:12:00 ~18:42:00 |
D |
32 |
1.0 |
4 |
1.0 |
18 |
18 |
.2 |
| 18:42:00~ 19:12:05 |
D |
32 |
1.0 |
4 |
1.0 |
20 |
18 |
.2 |
| 19:12:05~ 19:42:03 |
D |
32 |
1.0 |
4 |
1.0 |
21 |
18 |
.1 |
| avg |
|
32 |
1.0 |
4 |
1.0 |
19 |
17.25 |
.2 |
| example |
||||||||
| Time :17:42:01~ 18:12:00 Est Phys Estimated Est Size for Size Buffers Read Phys Reads Est Phys % dbtime P Est (M) Factr (thousands) Factr (thousands) Read Time for Rds --- -------- ----- ------------ ------ -------------- ------------ -------- D 4 .1 0 1.2 21 20 .4 D 8 .3 1 1.1 19 17 .3 D 12 .4 1 1.1 18 16 .3 D 16 .5 2 1.0 18 16 .3 D 20 .6 2 1.0 18 15 .3 D 24 .8 3 1.0 17 15 .3 D 28 .9 3 1.0 17 15 .3 D 32 1.0 4 1.0 17 15 .3 D 36 1.1 4 1.0 17 15 .3 D 40 1.3 5 1.0 17 15 .3 D 44 1.4 5 1.0 17 15 .3 D 48 1.5 6 1.0 17 15 .3 D 52 1.6 6 1.0 17 15 .3 D 56 1.8 7 1.0 17 15 .3 D 60 1.9 7 1.0 17 15 .3 D 64 2.0 8 1.0 17 15 .3 |
||||||||
分析:
对比4个时间段中的最佳buffer pool建议及第一时间段下的详细趋势列表,buffer pool设置为32m并未影响到性能。
⑥time model system stats
time:17:42:01~ 18:12:00
Statistic Time (s) % DB time
----------------------------------- -------------------- ---------
sql execute elapsed time 1,772.4 99.3
DB CPU 1,747.0 97.9
parse time elapsed 62.4 3.5
hard parse elapsed time 58.0 3.3
connection management call elapsed 6.2 .3
PL/SQL execution elapsed time 6.1 .3
hard parse (sharing criteria) elaps 6.1 .3
hard parse (bind mismatch) elapsed 3.9 .2
PL/SQL compilation elapsed time 0.7 .0
repeated bind elapsed time 0.4 .0
sequence load elapsed time 0.1 .0
DB time 1,784.9
background elapsed time 26.5
background cpu time 3.7
time:18:12:00 ~18:42:00
Statistic Time (s) % DB time
----------------------------------- -------------------- ---------
sql execute elapsed time 2,549.1 99.5
DB CPU 1,752.4 68.4
parse time elapsed 60.2 2.4
hard parse elapsed time 57.0 2.2
PL/SQL execution elapsed time 6.2 .2
hard parse (sharing criteria) elaps 6.2 .2
connection management call elapsed 6.1 .2
hard parse (bind mismatch) elapsed 4.0 .2
PL/SQL compilation elapsed time 0.7 .0
repeated bind elapsed time 0.4 .0
sequence load elapsed time 0.1 .0
DB time 2,561.0
background elapsed time 21.2
background cpu time 1.9
time:18:42:00~ 19:12:05
 最低0.47元/天 解锁文章


 157
157


 被折叠的 条评论
为什么被折叠?
被折叠的 条评论
为什么被折叠?
 到【灌水乐园】发言


