pyecharts+Django 使用指南====>Anaconda实现运行

1、参考自:http://blog.csdn.net/u013421629/article/details/78192402

别人的 :

本指南按照 Django 官方教程,通过完成一个 Django 小项目来说明如何在 Django 中使用 pyecharts。如果对 Django 还不太熟悉的开发者,可仔细阅读官方提供的最新文档。 
Step 0: 使用新的 virtualenv 环境

建议开发者使用 1.11.4 版本的 Django

$ virtualenv --no-site-packages pyecharts-env
$ source pyecharts-env/bin/activate
$ pip install django==1.11.4
$ pip install pyecharts
 
 
  • 1
  • 2
  • 3
  • 4

Step 1: 新建一个 django 项目

$ django-admin startproject myechartsite
 
 
  • 1

创建一个应用程序

$ python manage.py startapp myfirstvis
$ ls
db.sqlite3      manage.py       myechartsite    myfirstvis
 
 
  • 1
  • 2
  • 3

在 myechartsite/settings.py 中注册应用程序

# myechartsite/settings.py
...
INSTALLED_APPS = [
    'django.contrib.admin',
    'django.contrib.auth',
    'django.contrib.contenttypes',
    'django.contrib.sessions',
    'django.contrib.messages',
    'django.contrib.staticfiles',
    'myfirstvis'  # <---
]
...
 
 
  • 1
  • 2
  • 3
  • 4
  • 5
  • 6
  • 7
  • 8
  • 9
  • 10
  • 11
  • 12

我们先编辑 urls.py.这文件在 Django 里的功能是把前段的 HTTP 需求和后台服务函数挂钩。在 Step3,我们再引入后端服务函数

# myfirstvis/urls.py
from django.conf.urls import url

from . import views

urlpatterns = [
    url(r'^$', views.index, name='index'),
]
在 myechartsite/urls.py 中新增 'myfirstvis.urls'

myechartsite/urls.py
from django.conf.urls import include, url
from django.contrib import admin

urlpatterns = [
    url(r'^admin/', admin.site.urls),
    url(r'myfirstvis/', include('myfirstvis.urls'))  # <---
]
 
 
  • 1
  • 2
  • 3
  • 4
  • 5
  • 6
  • 7
  • 8
  • 9
  • 10
  • 11
  • 12
  • 13
  • 14
  • 15
  • 16
  • 17
  • 18

Step 2: 处理视图功能部分

将下列代码保存到 myfirstvis/views.py 中。

from __future__ import unicode_literals
import math

from django.http import HttpResponse
from django.template import loader
from pyecharts import Line3D

from pyecharts.constants import DEFAULT_HOST


def index(request):
    template = loader.get_template('myfirstvis/pyecharts.html')
    l3d = line3d()
    context = dict(
        myechart=l3d.render_embed(),
        host=DEFAULT_HOST,
        script_list=l3d.get_js_dependencies()
    )
    return HttpResponse(template.render(context, request))


def line3d():
    _data = []
    for t in range(0, 25000):
        _t = t / 1000
        x = (1 + 0.25 * math.cos(75 * _t)) * math.cos(_t)
        y = (1 + 0.25 * math.cos(75 * _t)) * math.sin(_t)
        z = _t + 2.0 * math.sin(75 * _t)
        _data.append([x, y, z])
    range_color = [
        '#313695', '#4575b4', '#74add1', '#abd9e9', '#e0f3f8', '#ffffbf',
        '#fee090', '#fdae61', '#f46d43', '#d73027', '#a50026']
    line3d = Line3D("3D line plot demo", width=1200, height=600)
    line3d.add("", _data, is_visualmap=True,
               visual_range_color=range_color, visual_range=[0, 30],
               is_grid3D_rotate=True, grid3D_rotate_speed=180)
    return line3d
 
 
  • 1
  • 2
  • 3
  • 4
  • 5
  • 6
  • 7
  • 8
  • 9
  • 10
  • 11
  • 12
  • 13
  • 14
  • 15
  • 16
  • 17
  • 18
  • 19
  • 20
  • 21
  • 22
  • 23
  • 24
  • 25
  • 26
  • 27
  • 28
  • 29
  • 30
  • 31
  • 32
  • 33
  • 34
  • 35
  • 36
  • 37

script_list 是 Page() 类渲染网页所需要依赖的 echarts js 库,依赖的库的数量取决于所要渲染的图形种类。

host 是 echarts js 库的地址,默认的地址为 http://chfw.github.io/jupyter-echarts/echarts 当然,如果你愿意你也可以改变这个地址,先克隆 https://github.com/chfw/jupyter-echarts 然后将 echarts 文件夹挂载在你自己的服务器上即可。

Step 3: 为项目提供自己的模板

前面的步骤是按照 tutorial part 1,接下来我们跳到 tutorial part 3

Linux/macos 系统

$ mkdir templates/myfirstvis -p
 
 
  • 1

Windows 系统 
在 myfirstvis 目录下,新建 templates/myfirstvis 子目录

myfirstvis 目录

─ myfirstvis 
├── admin.py 
├── apps.py 
├── init.py 
├── migrations 
│ ├── init.py 
├── models.py 
├── templates 
│ └── myfirstvis 
│ └── pyecharts.html 
├── tests.py 
├── urls.py 
└── views.py 
将下面 html 模板代码保存为 pyecharts.html,请确保 pyecharts.html 文件的绝对路径为 /myfirstvis/templates/myfirstvis

<!-- myfirstvis/templates/pyecharts.html -->
<!DOCTYPE html>
<html>

<head>
    <meta charset="utf-8">
    <title>Proudly presented by PycCharts</title>
    {% for jsfile_name in script_list %}
    <script src="{{host}}/{{jsfile_name}}.js"></script>
    {% endfor %}
</head>

<body>
  {{myechart|safe}}
</body>

</html>
 
 
  • 1
  • 2
  • 3
  • 4
  • 5
  • 6
  • 7
  • 8
  • 9
  • 10
  • 11
  • 12
  • 13
  • 14
  • 15
  • 16
  • 17

Step 4: 运行项目

$ cd myechartsite
$ python manage.py runserver
 
 
  • 1
  • 2
You have 13 unapplied migration(s). Your project may not work properly until you apply the migrations for app(s): admin, auth, contenttypes, sessions.
Run 'python manage.py migrate' to apply them.

August 08, 2017 - 05:48:38
Django version 1.11.4, using settings 'myechartsite.settings'
Starting development server at http://127.0.0.1:8000/
Quit the server with CONTROL-C.
 
 
  • 1
  • 2
  • 3
  • 4
  • 5
  • 6
  • 7

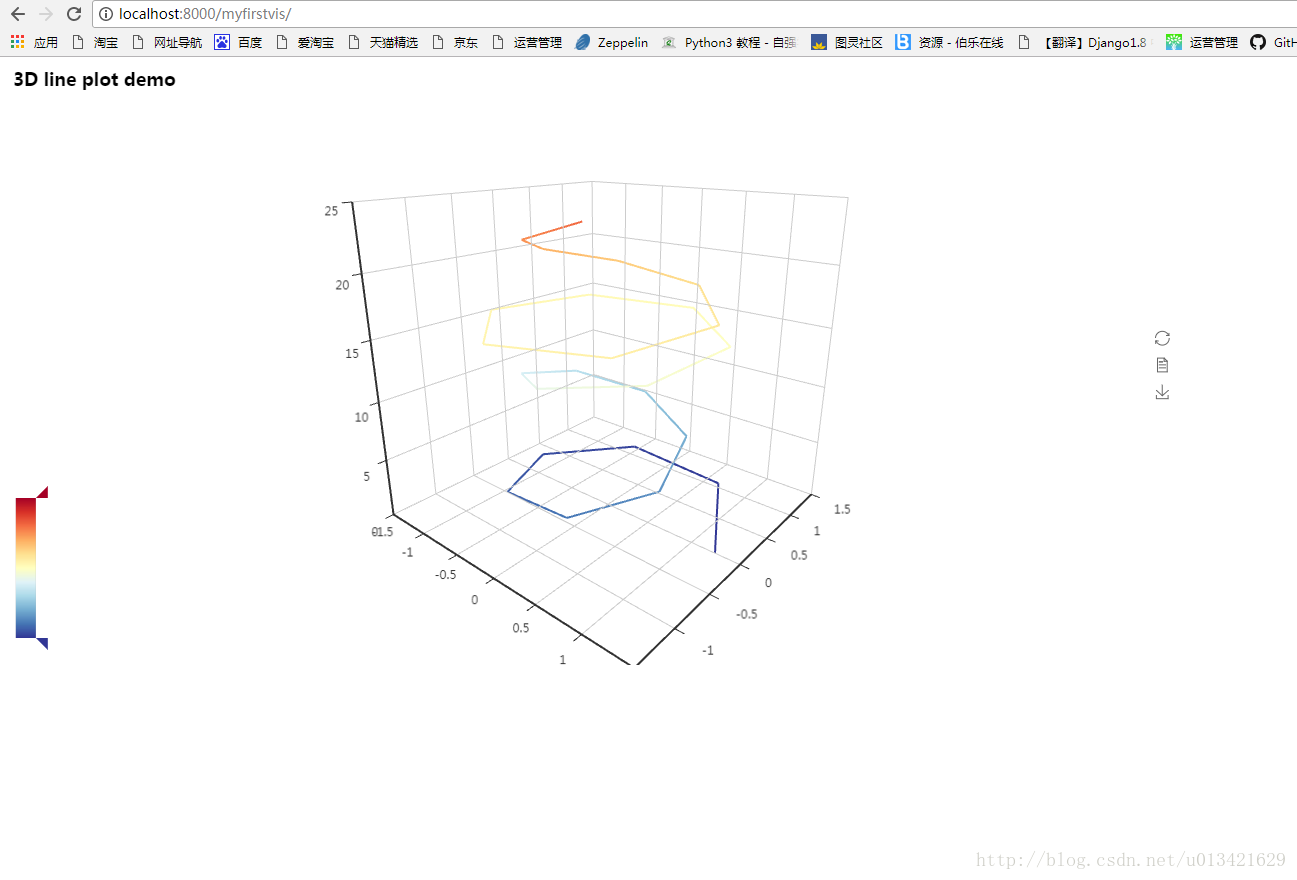
访问 http://localhost:8000/myfirstvis/,你就可以看到酷炫的 3D 图了

这里写图片描述

自己的:

在自己电脑上安装了Anaconda,并且用conda install pyecharts,Django,安装了pyecharts,Django。


此时默认是py2

然后就可以在


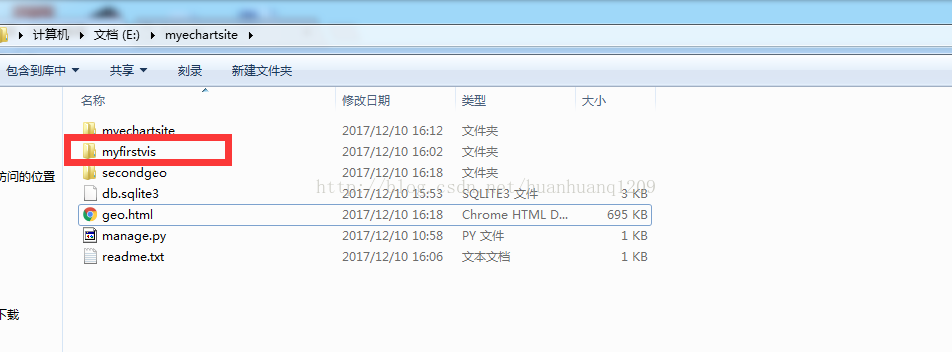
命令行下,创建Django项目,该项目可以放到任意自己想放的文件夹下。最后Django项目写好后,直接python manage.py runserver即可。

项目目录结构:


二、地图:首先呈现以下效果图:


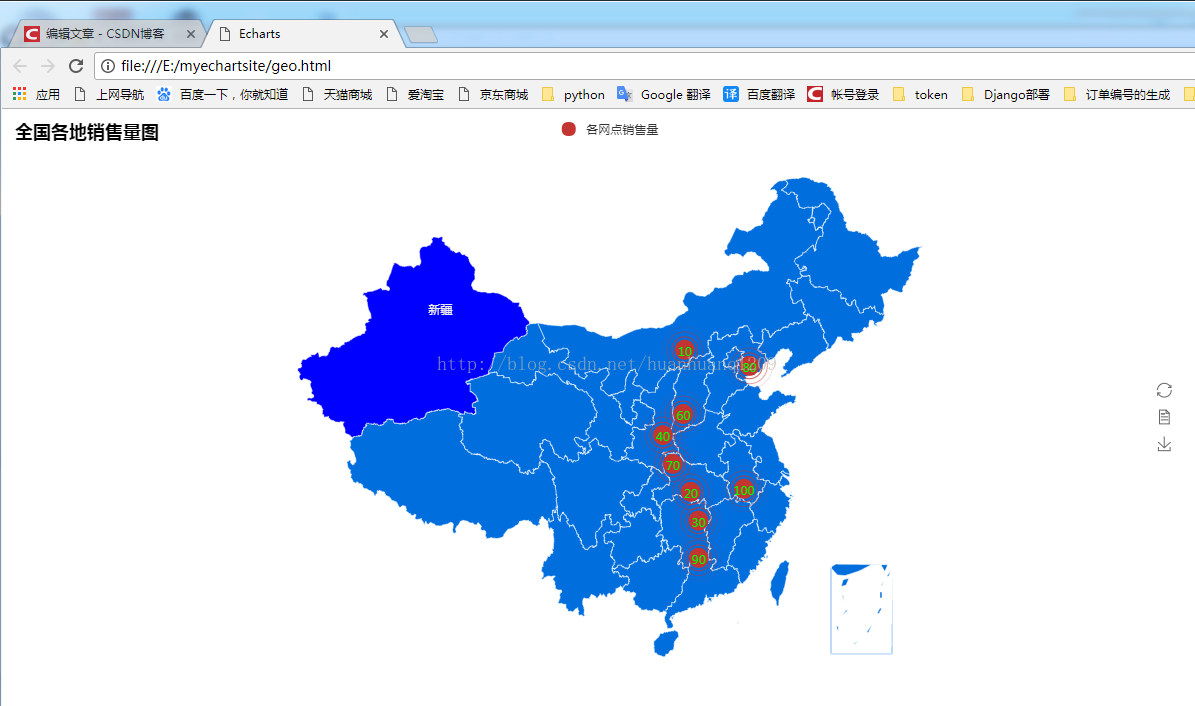
该图是自己在借用别人代码(http://blog.csdn.net/lxb1022/article/details/77119553)的基础上实现的:


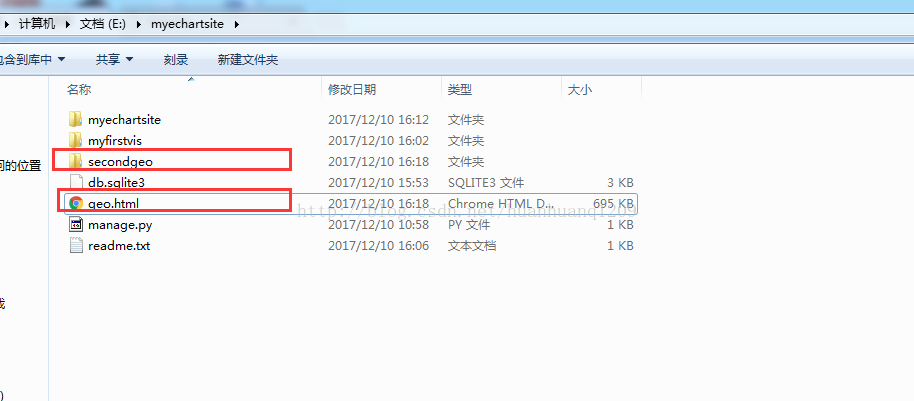
其中geo.html是项目运行secondgeo App后生成的。然后打开geo.html即可。代码如下,secondgeo中的views.py:

# -*- coding: utf-8 -*-
from __future__ import unicode_literals
from django.http import HttpResponse
#from django.shortcuts import render

import numpy as np  
import pandas as pd  
from pyecharts import Geo  
def index(request):
	value = [20,30,40,60,70,80,90,100,10]  
	attr = ['荆州','长沙','渭南','临汾','十堰','唐山','郴州','铜陵','呼和浩特']  
	geo = Geo("全国各地销售量图",width=1200,height=600)  
	geo.add("各网点销售量",attr,value,type="effectScatter",border_color="#ffffff",symbol_size=20,
			 is_label_show=True,label_text_color="#00FF00",label_pos="inside",symbol="circle",
			 symbol_color="FF0000",geo_normal_color="#006edd",geo_emphasis_color="#0000ff")
	geo.show_config()
	geo.render("geo.html")
	return HttpResponse( )

分析:

分三步,参数解释:
geo=Geo()
正标题,副标题,地图大小。
title_pos="center":标题位置
title_color="#fff":标题颜色
background_color='#404a59':背景颜色
geo.add()
type="effectScatter":是否有涟漪动画效果。
effect_scale=5:涟漪的多少。
symbol="circle":标记的形状(circle,pin,rect,diamon,roundRect,arrow,triangle)
symbol_size=20:标记大小
symbol_color="FF0000":标记颜色
geo_normal_color="#006edd":地图颜色
border_color="#ffffff":地图线条颜色
geo_emphasis_color="#0000ff":鼠标放在地图上的颜色
is_label_show=True:显示标签
label_text_color="#00FF00":标签颜色,本例是绿色
label_pos="inside":标签位置(inside,top,bottom,left,right)
is_visualmap=True:显示图例条
visual_range=[0, 300]:图例条范围
visual_text_color='#fff':图例条颜色


geo.render()
参数为保存的路径和名称。默认在当前目录下,,geo.html


  • 1
    点赞
  • 7
    收藏
    觉得还不错? 一键收藏
  • 0
    评论

“相关推荐”对你有帮助么?

  • 非常没帮助
  • 没帮助
  • 一般
  • 有帮助
  • 非常有帮助
提交
评论
添加红包

请填写红包祝福语或标题

红包个数最小为10个

红包金额最低5元

当前余额3.43前往充值 >
需支付:10.00
成就一亿技术人!
领取后你会自动成为博主和红包主的粉丝 规则
hope_wisdom
发出的红包
实付
使用余额支付
点击重新获取
扫码支付
钱包余额 0

抵扣说明:

1.余额是钱包充值的虚拟货币,按照1:1的比例进行支付金额的抵扣。
2.余额无法直接购买下载,可以购买VIP、付费专栏及课程。

余额充值