


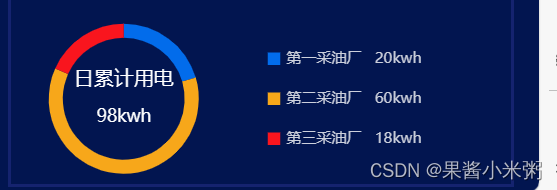
如图要实现一下效果:
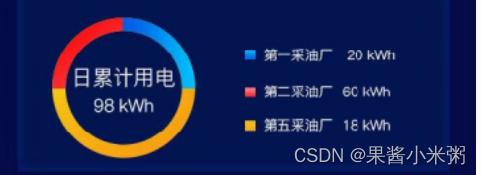
相关的配置:
option: {
legend: {
show: true, // 显示图例
orient: 'vertical',
x: 'left', // 图例水平位置
y: 'center', // 图例垂直位置
align: 'left',
left: '50%',
icon: 'square', // 图例形状
itemWidth: 10, // 图例项宽度
itemHeight: 10, // 图例项高度
itemGap: 20,
textStyle: {
color: '#fff',
opacity: .8
}
},
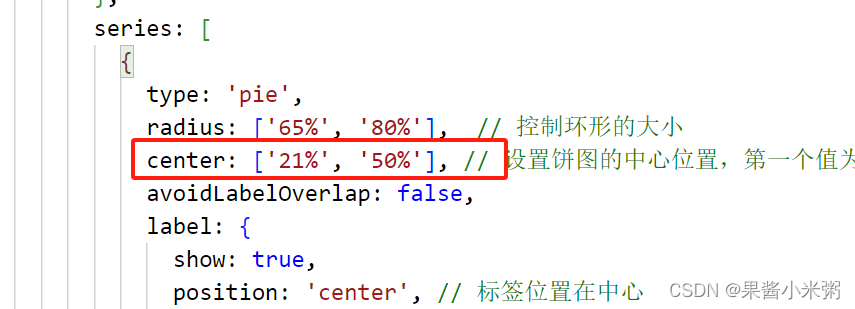
series: [
{
type: 'pie',
radius: ['65%', '80%'], // 控制环形的大小
center: ['21%', '50%'], // 设置饼图的中心位置,第一个值为水平方向,'left'表示在左边,'center'表示在中间,第二个值为垂直方向,'50%'表示在垂直方向的一半位置
avoidLabelOverlap: false,
label: {
show: true,
position: 'center', // 标签位置在中心
formatter: '{a|日累计用电}\n{b|98kwh}', // 使用 rich 属性设置不同的样式
rich: {
a: {
color: '#fff',
lineHeight: 30,
align: 'center',
fontSize: 16
},
b: {
color: '#fff',
lineHeight: 30,
align: 'center',
fontSize: 14
}
}
},
emphasis: {
label: {
show: true,
fontSize: '30',
fontWeight: 'bold'
}
},
labelLine: {
show: false
},
data: [
{ value: 20, name: '第一采油厂 20kwh', itemStyle: { color: '#026ceb' } },
{ value: 60, name: '第二采油厂 60kwh', itemStyle: { color: '#f7a71a' } },
{ value: 18, name: '第三采油厂 18kwh', itemStyle: { color: '#f9151e' } }
]
}
]
}这个配置相当重要,center的第一个值决定了环的位置
折腾了一个多小时,在快要放弃的时候终于实现了,皇天不负有心人!!!!!!!!!!!!


 1799
1799

 被折叠的 条评论
为什么被折叠?
被折叠的 条评论
为什么被折叠?
 到【灌水乐园】发言


