


对Spring Actuator提供13个REST端点详细说明(如/beans、/autoconfig、/shutdown等);SpringBoot整合Actuator及利用security开启安全验证。
SpringBoot actuator各个端点报告及说明
1.SpringBoot actuator简介
Spring Boot的Actuator提供了很多生产特性,比如监控和度量应用程序。这些特性可以通过REST端点、远程shell和JMX获得。
Spring Actuator提供了13个REST端点:/autoconfig,/configprops,/beans,/dump,/env,/env/{name} ,/health,/info,/mappings,/metrics,/metrics/{name},/shutdown,/trace:
| ID | 路径 | 请求方式 | 说明 |
|---|---|---|---|
| 1 | /autoconfig | GET | 自动配置报告,记录哪些自动配置条件是否通过 |
| 2 | /configprops | GET | 描述配置属性(包括默认值)如何注入的 |
| 3 | /beans | GET | 描述上下文所有bean,以及它们之间的关系 |
| 4 | /dump | GET | 获取线程活动快照 |
| 5 | /env | GET | 获取全部环境属性 |
| 6 | /env/{name} | GET | 获取特点环境属性 |
| 7 | /health | GET | 应用程序健康指标,由HealthIndicator的实现类提供 |
| 8 | /info | GET | 获取应用程序定制信息,这些信息有info打头的属性提供 |
| 9 | /mappings | GET | 描述全部URL路径,及它们和控制器(包括Actuator端点)的映射关系 |
| 10 | /metrics | GET | 报告各种应用程序度量信息,比如内存用量和http请求计算 |
| 11 | /metrics/{name} | GET | 报告指定名称的应用程序度量值 |
| 12 | /shutdown | GET | 关闭应用程序,要求endpoints.shutdown.enabled设值为true |
| 13 | /trace | GET | 提供基本的HTTP请求跟踪信息,时间戳,HTTP头等 |
2.SpringBoot整合Actuator
依赖包
<dependency>
    <groupId>org.springframework.boot</groupId>
    <artifactId>spring-boot-starter-actuator</artifactId>
    <version>${boot.starter.version}</version>
</dependency>
配置端口
management:
port: 54001访问http://127.0.0.1:54001/beans
出现{"timestamp":1524493844596,"status":401,"error":"Unauthorized","message":"Full authentication is required to access this resource.","path":"/beans"}
原因:Actuator默认启动了安全验证,防止他人的访问,导致信息泄露。
解决办法:
1. 关闭安全验证
management:
  port: 54001
  security:
enabled: false- 开启验证
需要引入Security依赖
<dependency>
    <groupId>org.springframework.boot</groupId>
    <artifactId>spring-boot-starter-security</artifactId>
    <version>${boot.starter.version}</version>
</dependency>
并配置用户名密码
security:
  user:
    name: admin
    password: admin
也可以设值角色
management:
  security:
    roles: SUPERUSER
如果未配置
默认用户名:user
默认密码在启动时控制台日志中打印出来:Using default security password: 4895b175-2805-440b-9915-439b22fadb5c
访问端点地址
弹出
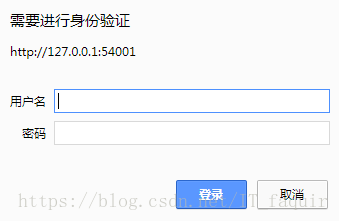
输入正确用户名密码,即可完成验证,展示出JSON结果数据
但是当加上Security时,默认会对所有的路径加上授权,导致原有开放的路径也需要身份验证了,这样会引起公愤的。
解决办法:Security支持只针对某个路径进行身份授权,只需要在yam中进行配置即可
security:
  basic:
    path: /bean
path对应方法,接受的参数如下:
public void setPath(String... paths) {
    this.path = paths;
}
可见,可以指定多个路径,进行授权管理。为了方便设置与统一管理监控的端点,可以将相关路径,设置一个上下文。
自定义管理服务器的上下文路径
有时候为了方便管理,或者路径被占用,设置路径上下问很有用。你可以用management.contextPath属性为管理端口设置一个前缀:
例如
management.context-path=/manage这样就将所有访问端点加上了/manage前缀,如访问http://127.0.0.1:54001/manage/beans
3.各监控端点说明
1. bean的装配报告
/beans描述上下文所有bean,以及它们之间的关系
[
    {
        "context": "application:prod:80:management",
        "parent": "application:prod:80",
        "beans": [
......
            {
                "bean": "embeddedServletContainerFactory",
                "aliases": [],
                "scope": "singleton",
                "type": "org.springframework.boot.context.embedded.tomcat.TomcatEmbeddedServletContainerFactory",
                "resource": "null",
                "dependencies": []
            },
            {
                "bean": "endpointHandlerMapping",
                "aliases": [],
                "scope": "singleton",
                "type": "org.springframework.boot.actuate.endpoint.mvc.EndpointHandlerMapping",
                "resource": "class path resource [org/springframework/boot/actuate/autoconfigure/EndpointWebMvcManagementContextConfiguration.class]",
                "dependencies": [
                    "mvcEndpoints"
                ]
            }
......
            ]
        }
    }
]以上为\beans端点返回的josn信息片段,如你所见,所有的bean都有6类信息
beanbean的名称或ID列表
resource.class文件的物理位置,通常是一个URL,指向构造出的JAR文件,会随应用程序的构造和运行方式发生变化。
aliasesbean的别名(后期版本有,具体哪个版本不晓得,当前4.2.7)
dependencies当前bean注入的beanID列表。
scopebean的作用域。
typebean的java类型。
2. 自动配置报告
/autoconfig 记录哪些自动配置条件是否通过,报告包含成功匹配和匹配失败的。
{
    "positiveMatches": {
    ......
        "AuditAutoConfiguration#auditListener": [
            {
                "condition": "OnBeanCondition",
                "message": "@ConditionalOnMissingBean (types: org.springframework.boot.actuate.audit.listener.AbstractAuditListener; SearchStrategy: all) did not find any beans"
            }
        ],
        "AuditAutoConfiguration#authenticationAuditListener": [
            {
                "condition": "OnClassCondition",
                "message": "@ConditionalOnClass found required class 'org.springframework.security.authentication.event.AbstractAuthenticationEvent'; @ConditionalOnMissingClass did not find unwanted class"
            }]
        ......
            },
    "negativeMatches":{
   ...... "CacheStatisticsAutoConfiguration.CaffeineCacheStatisticsProviderConfiguration": {
        "notMatched": [
            {
                "condition": "OnClassCondition",
                "message": "@ConditionalOnClass did not find required classes 'com.github.benmanes.caffeine.cache.Caffeine', 'org.springframework.cache.caffeine.CaffeineCacheManager'"
            }
        ],
        "matched": []
    },
    "CacheStatisticsAutoConfiguration.EhCacheCacheStatisticsProviderConfiguration": {
        "notMatched": [
            {
                "condition": "OnClassCondition",
                "message": "@ConditionalOnClass did not find required classes 'org.springframework.cache.ehcache.EhCacheCache', 'net.sf.ehcache.Ehcache', 'net.sf.ehcache.statistics.StatisticsGateway'"
            }
        ],
        "matched": []
    }]
    ......
    }
}
positiveMatches对象为成功配置的条件报告,negativeMatches为未成功匹配的条件
3. 查看配置属性
/env端点会生成应用程序可用的所有环境属性的列表,包括了环境变量、JVM属性、命令行参数,以及application.properties或application.yml文件中的配置。
当然在配置文件中会有一些敏感信息,如果暴露的话后果会很严重,这一点actuator已经为此考虑到,在/env端点中所有名为password、secret、key(**或名字中最后一段是这些**eg:userKey)的属性值,用*显示
例子:
yaml中
security
    user
        password: admin
/env端点显示
"security.user.password": "******"报告片段
{
    "profiles": [
        "prod"
    ],
    "server.ports": {
        "local.management.port": 8080,
        "local.server.port": 80
    },
    "servletContextInitParams": {},
    "systemProperties": {
        "java.vendor": "Oracle Corporation",
        "jboss.modules.system.pkgs": "com.intellij.rt",
        "sun.java.launcher": "SUN_STANDARD",
        "sun.management.compiler": "HotSpot 64-Bit Tiered Compilers",
        "catalina.useNaming": "false",
        "spring.output.ansi.enabled": "always"
        ......
         },
    "systemEnvironment": {
        "USERDOMAIN_ROAMINGPROFILE": "DESKTOP-DFPA111",
        "PROCESSOR_LEVEL": "6",
        "USERDOMAIN": "DESKTOP-DFPA111",
        "FPS_BROWSER_APP_PROFILE_STRING": "Internet Explorer",
        "LOGONSERVER": "\\\\DESKTOP-DFPA111"
        ......
         },
    "applicationConfig: [classpath:/config/application.yml]": {
        "spring.profiles.active": "prod",
        "spring.cache.ehcache.config": "ehcache-setting.xml",
        "spring.thymeleaf.content-type": "text/html",
        "spring.thymeleaf.mode": "LEGACYHTML5",
        "spring.http.multipart.max-file-size": "1MB",
        "spring.jmx.default-domain": "bookClient",
        "server.port": 80,
        "security.user.name": "admin",
        "security.user.password": "******"
        ......
    }
}
从报告片段可以看出配置可以分为以下几类:
- profiles 当前使用的环境配置
- server.ports 相关端口配置
- servletContextInitParams servler相关参数配置
- systemProperties 系统属性配置
- systemEnvironment 系统环境配置
- applicationConfig 应用的配置
可以注意到带
password的属性值显示为******
如果只想知道特定属性的配置情况,那么可以通过/env/{name}(name为制定的属性名)获取
例如想知道security.user.name的属性情况,那么可以如下方式获取
http://127.0.0.1:54001/env/security.user.name这些环境属性都可以通过@ConfigurationPriperties注解,注入到对应的Bean中,供我们使用.
4. 配置属性报告
/configprops端点报告,显示所有通过@ConfigurationPriperties注入到bean的属性
报告片段
{
    ...
    "endpoints-org.springframework.boot.actuate.endpoint.EndpointProperties": {
        "prefix": "endpoints",
        "properties": {
            "enabled": true,
            "sensitive": null
        }
    },
    ...
    "systemConfig": {
        "prefix": "systemConfig",
        "properties": {
            "coverBasePath": "/usr/cover-img"
        }
    ...
}
报告内容包括了spring注入的和自己应用程序注入的。
结构上可以看出,包括了属性名称,属性下又包括前缀prefix和具体属性及值properties
5. 生成所有控制器端点映射关系报告
/mappings端点显示所有控制器中所有端点,可以很方便得让我们知道到有那些接口。
报告片段
{
    .....
    "/cover/**": {
        "bean": "resourceHandlerMapping"
    },
    "/**/favicon.ico": {
        "bean": "faviconHandlerMapping"
    },
    "{[/mine/info],methods=[GET]}": {
        "bean": "requestMappingHandlerMapping",
        "method": "public java.lang.String team.seagull.novelclient.web.controller.NovelUserController.mineInfo(org.springframework.ui.ModelMap)"
    },
    "{[/mine/info],methods=[PUT]}": {
        "bean": "requestMappingHandlerMapping",
        "method": "public team.seagull.common.base.common.CommonResult<java.lang.Boolean> team.seagull.novelclient.web.controller.NovelUserController.editMineInfo(org.springframework.ui.ModelMap,team.seagull.novelclient.common.form.UserForm)"
    }
    ......
}从报告中可以看出bean属性显示了对应的HandlerMapping(处理器映射),我们最常见莫过于通过requestMappingHandlerMapping映射的接口,method属性显示了我们在控制器中接口对应的实现方法,同时json对象名信息包括了使用@RequetMapping配置的接口信息。
6. 应用程序度量报告
/metrics端点为我们提供了应用程序运行时的一些情况,比如内存、线程、类加载数量等等的计数和度量情况
报告片段
{
    "mem": 379698,//系统分配的内存(k)
    "mem.free": 204406,//空闲内存(k)
    "processors": 8,//处理器数量
    "instance.uptime": 95093826,//实例运行时间(ms)
    "uptime": 95110093,//正常运行时间(ms)
    "systemload.average": -1,//平均负载
    "heap.committed": 316416,
    "heap.init": 131072,
    "heap.used": 112009,
    "heap": 1837056,//堆内存(k)
    "nonheap.committed": 64592,
    "nonheap.init": 2496,
    "nonheap.used": 63283,
    "nonheap": 0,//非堆内存(k)
    "threads.peak": 60,//线程峰值
    "threads.daemon": 40,//精灵线程
    "threads.totalStarted": 94,
    "threads": 44,
    "classes": 8524,
    "classes.loaded": 8524,//类加载器加载数量
    "classes.unloaded": 0,
    "gc.ps_scavenge.count": 11,//垃圾收集次数
    "gc.ps_scavenge.time": 105,//垃圾收集总时间ms
    "gc.ps_marksweep.count": 2,//标记垃圾收集器次数
    "gc.ps_marksweep.time": 150,//标记垃圾收集齐所花事件
    "httpsessions.max": -1,
    "httpsessions.active": 1,
    "datasource.primary.active": 0,
    "datasource.primary.usage": 0,
    "gauge.response.sign_in": 11,
    "gauge.response.root": 179,
    "gauge.response.star-star": 3,
    "counter.status.200.root": 11,
    "counter.status.200.star-star": 33,//返回状态为200的请求数
    "counter.status.404.star-star": 12,
    "counter.status.200.sign_in": 1//sign_in端点请求,状态为200的次数
    ......
}
可以将报告提供的信息分为以下几类
| ID | 分类 | 前缀 | 报告内容 |
|---|---|---|---|
| 1 | 垃圾收集器 | gc.* | 详见报告注释 |
| 2 | 内存 | mem.* | 详见报告注释 |
| 3 | 堆 | heap.* | 堆内存使用情况 |
| 4 | 类加载器 | classes.* | JVM类的加载与卸载的数量 |
| 5 | 系统 | processors,uptime, instance.uptime, systemload.average | 系统信息,堆内存使用情况 |
| 6 | 线程池 | threads.* | 线程、守护线程的数量,以及线程数最大峰值 |
| 7 | 数据源 | datasource.* | 数据源链接的数量,仅Spring上下文里存在DataSource Bean的时候才会有该信息 |
| 8 | Tomcat会话 | httpsessions.* | tomcat活跃会话数和最大会话数,该度量指标信息仅在引入了嵌入式Tomcat作为应用容器的时候才会提供。 |
| 9 | HTTP | counter.status., gauge.response. | 服务HTTP请求的度量值域计数器 |
如果只想知道某一个属性信息的情况,可以直接指定属性/metrics/{name}(name为指定的属性名)。
如想知道垃圾收集次数,那么可以如下方式访问
http://127.0.0.1:54001/manager/metrics/gc.ps_scavenge.count,则只会返回指定属性的结果。
7. 追踪Web请求
/trace端点提供了详细的Web请求情况,但只显示最近100个请求信息,因为如果全部显示,对于对外的应用数据量是非常巨大的。
报告片段
[
    ...
    {
        "timestamp": 1525513700582,
        "info": {
            "method": "GET",
            "path": "/sign_in",
            "headers": {
                "request": {
                    "host": "127.0.0.1",
                    "connection": "keep-alive",
                    "upgrade-insecure-requests": "1",
                    "user-agent": "Mozilla/5.0 (Windows NT 10.0; WOW64) AppleWebKit/537.36 (KHTML, like Gecko) Chrome/66.0.3359.139 Safari/537.36",
                    "accept": "text/html,application/xhtml+xml,application/xml;q=0.9,image/webp,image/apng,*/*;q=0.8",
                    "referer": "http://127.0.0.1/",
                    "accept-encoding": "gzip, deflate, br",
                    "accept-language": "zh-CN,zh;q=0.9",
                    "cookie": "JSESSIONID=3ED7BB75D0FE8D7F670422FE0A89F3B0"
                },
                "response": {
                    "X-Application-Context": "application:prod:80",
                    "Cache-Control": "no-store",
                    "Content-Type": "text/html;charset=UTF-8",
                    "Content-Language": "zh-CN",
                    "Transfer-Encoding": "chunked",
                    "Date": "Sat, 05 May 2018 09:48:20 GMT",
                    "status": "200"
                }
            },
            "timeTaken": "11"
        }
    }
    ...
]
报告中显示对/sign_in请求的详细信息,包括请求方法、路径、时间戳、以及请求和响应的头信息。
8. 导出线程活动
/dump端点会生成当前线程活动的快照,报告会包含应用程序的每一个线程。包含了很多线程特点的信息,以及线程堵塞和锁状态。
报告片段
[
......
    {
        "threadName": "http-nio-80-exec-10",
        "threadId": 73,
        "blockedTime": -1,
        "blockedCount": 9,
        "waitedTime": -1,
        "waitedCount": 15,
        "lockName": "java.util.concurrent.locks.AbstractQueuedSynchronizer$ConditionObject@2ea4eb7b",
        "lockOwnerId": -1,
        "lockOwnerName": null,
        "inNative": false,
        "suspended": false,
        "threadState": "WAITING",
        "stackTrace": [
            {
                "methodName": "park",
                "fileName": "LockSupport.java",
                "lineNumber": 175,
                "className": "java.util.concurrent.locks.LockSupport",
                "nativeMethod": false
            },
            {
                "methodName": "await",
                "fileName": "AbstractQueuedSynchronizer.java",
                "lineNumber": 2039,
                "className": "java.util.concurrent.locks.AbstractQueuedSynchronizer$ConditionObject",
                "nativeMethod": false
            },
            {
                "methodName": "take",
                "fileName": "TaskQueue.java",
                "lineNumber": 31,
                "className": "org.apache.tomcat.util.threads.TaskQueue",
                "nativeMethod": false
            },
            {
                "methodName": "getTask",
                "fileName": "ThreadPoolExecutor.java",
                "lineNumber": 1074,
                "className": "java.util.concurrent.ThreadPoolExecutor",
                "nativeMethod": false
            },
            {
                "methodName": "runWorker",
                "fileName": "ThreadPoolExecutor.java",
                "lineNumber": 1134,
                "className": "java.util.concurrent.ThreadPoolExecutor",
                "nativeMethod": false
            },
            {
                "methodName": "run",
                "fileName": "ThreadPoolExecutor.java",
                "lineNumber": 624,
                "className": "java.util.concurrent.ThreadPoolExecutor$Worker",
                "nativeMethod": false
            },
            ......
        ],
        "lockedMonitors": [],
        "lockedSynchronizers": [],
        "lockInfo": {
            "className": "java.util.concurrent.locks.AbstractQueuedSynchronizer$ConditionObject",
            "identityHashCode": 782560123
        }
    }
    ......
]
9. 健康应用程序健康情况
/health端点提供了应用程序是否启动,数据库连接是否正常等情况信息
报告片段
{
    "status": "UP",
    "diskSpace": {
        "status": "UP",
        "total": 39362490368,
        "free": 37886214144,
        "threshold": 10485760
    },
    "redis": {
        "status": "UP",
        "version": "3.2.100"
    },
    "db": {
        "status": "UP",
        "database": "MySQL",
        "hello": 1
    }
}
从报告片段中可以看出系统的进步情况,以及和其他数据库之间的连接情况。对于系统的检查来说很有帮助。
10. 关闭应用程序
/shutdown端点和其他端点有所不同,该端点为操作型端点,且非常危险的一个端点,因为它可以关闭应用程序,通常改端点是未开启状态,如需要可以在配置文件中进行开启。
endpoints:
    shutdowns:
        enabled:true
11. 获取应用信息
/info 该端点,默认情况没有数据的,可以通过配置带info前缀的任意属性向/info端点添加内容。
例如你想添加你的电话和邮箱,那么可以在配置文件这样配置
info:
  phone: 14284923744
  email: 123@email.com
要有确保info前缀即可,后缀可自由定义。
{
    "phone": "14284923744",
    "email": "123@email.com"
}


 2万+
2万+


 被折叠的 条评论
为什么被折叠?
被折叠的 条评论
为什么被折叠?
 到【灌水乐园】发言


