


xml文件,主要关注标签为com.github.mikephil.charting.charts.LineChart的部分即可:
<?xml version="1.0" encoding="utf-8"?>
<LinearLayout xmlns:android="http://schemas.android.com/apk/res/android"
android:layout_width="match_parent"
android:layout_height="match_parent"
android:layout_marginLeft="10dp"
android:layout_marginRight="10dp"
android:orientation="vertical" >
<RadioGroup
android:id="@+id/rg_normal"
android:layout_width="match_parent"
android:layout_height="40dp"
android:layout_marginTop="10dp"
android:background="@drawable/shape_radio_group_bg"
android:gravity="center_vertical"
android:orientation="horizontal"
android:weightSum="3" >
<RadioButton
android:id="@+id/btn_week"
android:layout_width="0dp"
android:layout_height="match_parent"
android:layout_weight="1"
android:background="@drawable/radio_button_left_with_checked"
android:button="@null"
android:checked="true"
android:gravity="center"
android:text="周报" />
<RadioButton
android:id="@+id/btn_month"
android:layout_width="0dp"
android:layout_height="38dp"
android:layout_weight="1"
android:background="@drawable/radio_button_middle_with_checked"
android:button="@null"
android:gravity="center"
android:text="月报" />
<RadioButton
android:id="@+id/btn_season"
android:layout_width="0dp"
android:layout_height="match_parent"
android:layout_weight="1"
android:background="@drawable/radio_button_right_with_checked"
android:button="@null"
android:gravity="center"
android:text="季报" />
</RadioGroup>
<ScrollView
android:layout_width="match_parent"
android:layout_height="wrap_content"
android:layout_marginBottom="10dp"
android:layout_marginTop="10dp" >
<LinearLayout
android:layout_width="match_parent"
android:layout_height="wrap_content"
android:orientation="vertical" >
<!-- 温度 -->
<TextView
android:layout_width="wrap_content"
android:layout_height="wrap_content"
android:text="温度(℃)" />
<com.github.mikephil.charting.charts.LineChart
android:id="@+id/lc_history_temperature"
android:layout_width="match_parent"
android:layout_height="200dp"
android:layout_marginBottom="10dp" />
<!-- 湿度 -->
<TextView
android:layout_width="wrap_content"
android:layout_height="wrap_content"
android:text="湿度" />
<com.github.mikephil.charting.charts.LineChart
android:id="@+id/lc_history_humidity"
android:layout_width="match_parent"
android:layout_height="200dp"
android:layout_marginBottom="10dp" />
<!-- 氨气浓度 -->
<TextView
android:layout_width="wrap_content"
android:layout_height="wrap_content"
android:text="氨气浓度" />
<com.github.mikephil.charting.charts.LineChart
android:id="@+id/lc_history_ammonia"
android:layout_width="match_parent"
android:layout_height="200dp" />
</LinearLayout>
</ScrollView>
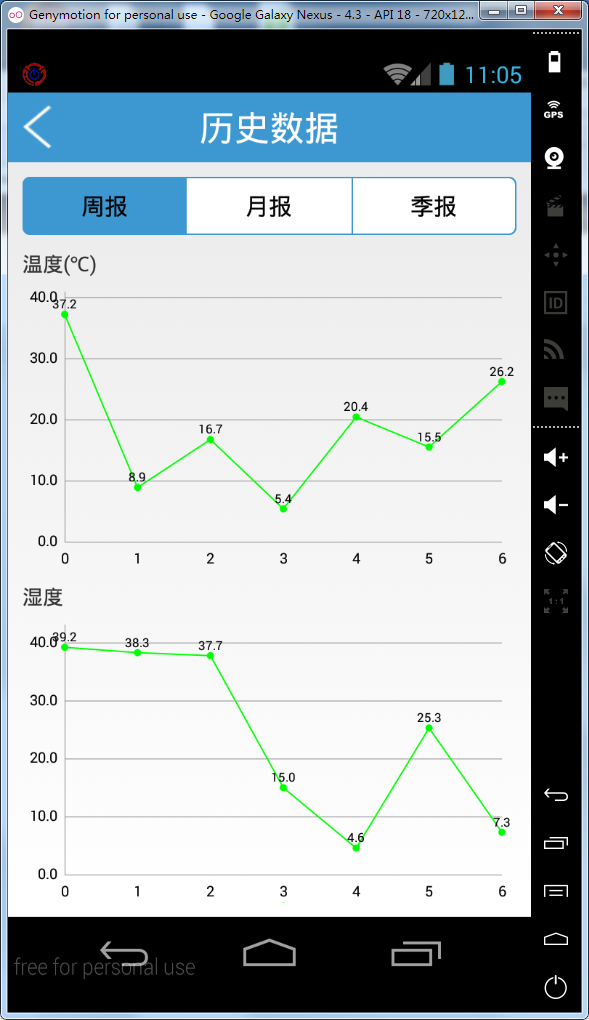
</LinearLayout>1.获取折线图数据的方法:
/**
     * 生成一个数据
     * @param count 表示图表中有多少个坐标点
     * @param range 用来生成range以内的随机数
     * @return
     */
    private LineData getLineData(int count, float range) {
        ArrayList<String> xValues = new ArrayList<String>();
        for (int i = 0; i < count; i++) {
            // x轴显示的数据,这里默认使用数字下标显示
            xValues.add("" + i);
        }

        ArrayList<LineDataSet> lineDataSets = new ArrayList<LineDataSet>();
        // y轴的数据 1======================================start
        ArrayList<Entry> yValues = new ArrayList<Entry>();
        for (int i = 0; i < count; i++) {
            float value = (float) (Math.random() * range) + 3;
            yValues.add(new Entry(value, i));
        }

        // create a dataset and give it a type
        // y轴的数据集合
        LineDataSet lineDataSet = new LineDataSet(yValues, "" /*测试折线图*/);
        // mLineDataSet.setFillAlpha(110);
        // mLineDataSet.setFillColor(Color.RED);

        //用y轴的集合来设置参数
        // 线宽
        lineDataSet.setLineWidth(1.0f);
        // 显示的圆形大小
        lineDataSet.setCircleSize(2.5f);
        // 显示颜色
        lineDataSet.setColor(Color.GREEN);
        // 圆形的颜色
        lineDataSet.setCircleColor(Color.GREEN);
        // 高亮的线的颜色
        lineDataSet.setHighLightColor(Color.GREEN);
        // 设置圆点的颜色
        lineDataSet.setFillColor(Color.GREEN);
        lineDataSet.setDrawCircleHole(false);
        //lineDataSet.setValueTextSize(9f);
        lineDataSet.setFillAlpha(65);

        lineDataSets.add(lineDataSet);
        // y轴的数据 1======================================end

        // create a data object with the datasets
        LineData lineData = new LineData(xValues, lineDataSets);
        return lineData;
    }
2.显示数据的方法:
/**
     * 显示数据
     * @param lineChart
     * @param lineData
     * @param color
     */
    private void showChart(LineChart lineChart, LineData lineData, int color) {
        //是否在折线图上添加边框
        lineChart.setDrawBorders(false);

        // 数据描述
        lineChart.setDescription("");
        // 如果没有数据的时候,会显示这个,类似listview的emtpyview
        lineChart.setNoDataTextDescription("暂无数据");

        // 是否显示表格颜色
        lineChart.setDrawGridBackground(false);
        // 表格的的颜色,在这里是是给颜色设置一个透明度
        //lineChart.setGridBackgroundColor(Color.WHITE & 0x70FFFFFF);

        // 设置是否可以触摸
        lineChart.setTouchEnabled(true);
        // 是否可以拖拽
        lineChart.setDragEnabled(true);
        // 是否可以缩放
        lineChart.setScaleEnabled(true);

        // if disabled, scaling can be done on x- and y-axis separately
        lineChart.setPinchZoom(false);

        //lineChart.setBackgroundColor(Color.rgb(Integer.parseInt("7e", 16), Integer.parseInt("ce", 16), Integer.parseInt("f4", 16)));// 设置背景
        // 设置数据
        lineChart.setData(lineData);

        // 设置比例图标示,就是那个一组y的value的
        Legend mLegend = lineChart.getLegend();
        //mLegend.setPosition(LegendPosition.BELOW_CHART_CENTER);
        // 样式
        mLegend.setForm(LegendForm.CIRCLE);
        // 字体
        mLegend.setFormSize(0f);
        // 颜色
        mLegend.setTextColor(Color.RED);
        // 字体
        //mLegend.setTypeface(mTf);

        // 设置Y轴右边不显示数字
        lineChart.getAxisRight().setEnabled(false);

        XAxis xAxis = lineChart.getXAxis();
        // 设置X轴的数据显示在报表的下方
        xAxis.setPosition(XAxisPosition.BOTTOM);
        //xAxis.setDrawAxisLine(false);
        // 设置不从X轴发出纵向直线
        xAxis.setDrawGridLines(false);
        // 立即执行的动画,x轴
        lineChart.animateX(2500);
    }
3.初始化、调用:
// 温度
        lc_history_temperature = (LineChart) findViewById(R.id.lc_history_temperature);
        // 湿度
        lc_history_humidity = (LineChart) findViewById(R.id.lc_history_humidity);
        // 氨气浓度
        lc_history_ammonia = (LineChart) findViewById(R.id.lc_history_ammonia);

        mTemperatureData = getLineData(7, 40);
        mHumidityData = getLineData(7, 40);
        mAmmoniaData = getLineData(7, 40);

        showChart(lc_history_temperature, mTemperatureData, R.color.red_failed);
        showChart(lc_history_humidity, mHumidityData, R.color.red_failed);
        showChart(lc_history_ammonia, mAmmoniaData, R.color.red_failed);
效果图如下:


 803
803

 被折叠的 条评论
为什么被折叠?
被折叠的 条评论
为什么被折叠?
 到【灌水乐园】发言


