echarts-柱状图:实现横向柱状体排名

本文介绍了如何利用Echarts库在JavaScript中实现一个横向排列的柱状图,用于展示数据的排名效果。代码详细展示了如何配置X轴、Y轴以及系列参数,以达到预期的视觉效果。
摘要由CSDN通过智能技术生成

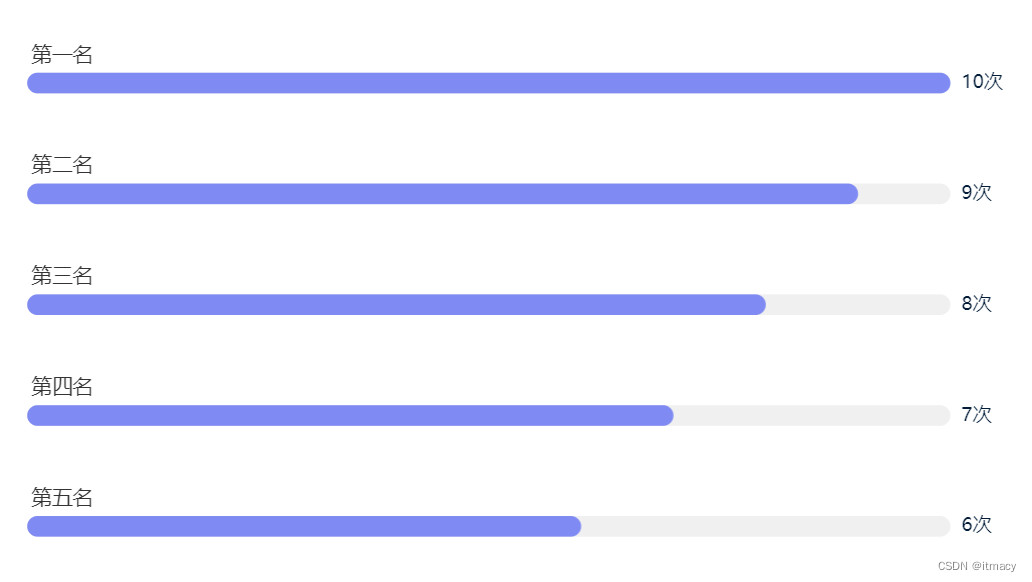
使用echarts实现横向柱状图横向排名的效果如下:
在这里插入图片描述

代码如下:

let nameList = ['第一名', '第二名', '第三名', '第四名', '第五名'];
let dataList = [10, 9, 8, 7, 6];
option = {
  color: ['#7F8AF2'],
  grid: {
    left: '5%',
    right: '5%',
    top: '10%',
    bottom: '0',
    containLabel: true
  },
  xAxis: {
    show: false,
    type: 'value'
  },
  yAxis: [
    {
      show: true,
      type: 'category',
      axisTick: {
        // 轴刻度线
        show: false
      },
      axisLine: {
        // 轴
        show: false
      },
      inverse: 'true', // 排序,
      axisLabel: {
        show: true,
        inside: true,
        interval: 0, //横轴信息全部显
        splitNumber: 50,
        color: '#333333',
        verticalAlign: 'bottom',
        fontSize: 15,
        align: 'left',
        padding: [0, 0, 12, -5]
      },
      data: nameList
    },
    {
      type: 'category',
      axisLine: {
        show: false
      },
      axisTick: {
        show: false
      },
      axisLabel: {
        show: true,
        inside: false,
        color: '#021C38',
        fontSize: '14',
        formatter: function (v) {
          return v + '次';
        }
      },
      splitArea: {
        show: false
      },
      splitLine: {
        show: false
      },
      inverse: 'true', // 排序
      data: dataList
    }
  ],
  series: [
    {
      inverse: 'true', // 排序
      data: dataList,
      type: 'bar',
      showBackground: true,
      backgroundStyle: {
        borderRadius: 40
      },
      barWidth: '15',
      itemStyle: {
        borderRadius: 10
        // color: (param) => {
        //   //实现柱状图条 下面四种颜色循环显示
        //   let colorList = ['#e74c3c','#ffa865', '#f8d26b', '#74dcc4', '#47c0ff']
        //   return colorList[param.dataIndex % 5]
        // }
      }
    }
  ]
};

备注:可直接复制代码到echarts实例中运行:https://echarts.apache.org/examples/zh/editor.html?c=bar-simple

  • 10
    点赞
  • 13
    收藏
    觉得还不错? 一键收藏
  • 0
    评论
对于vue3-seamless-scroll无缝滚动echarts横向柱状图,你可以按照以下步骤进行操作: 1. 首先,安装vue3-seamless-scroll和echarts依赖: ```shell npm install vue3-seamless-scroll echarts ``` 2. 在Vue组件中引入vue3-seamless-scroll和echarts: ```javascript import { defineComponent } from 'vue'; import VueSeamlessScroll from 'vue3-seamless-scroll'; import * as echarts from 'echarts'; ``` 3. 在Vue组件的template中添加一个容器元素,用于渲染echarts图表: ```html <template> <div class="chart-container"> <vue-seamless-scroll> <div class="chart-item" v-for="dataItem in data" :key="dataItem.id"> <div class="chart" ref="chart"></div> </div> </vue-seamless-scroll> </div> </template> ``` 4. 在Vue组件的script中定义data和mounted钩子函数: ```javascript export default defineComponent({ data() { return { data: [ { id: 1, value: 100 }, { id: 2, value: 200 }, { id: 3, value: 300 }, // 添加更多数据项... ] }; }, mounted() { this.initCharts(); }, methods: { initCharts() { this.data.forEach((dataItem) => { const chartElement = this.$refs.chart[dataItem.id - 1]; const chart = echarts.init(chartElement); // 使用echarts配置生成横向柱状图 const option = { xAxis: { type: 'value' }, yAxis: { type: 'category', data: ['A', 'B', 'C', 'D', 'E', 'F'] }, series: [{ type: 'bar', data: [dataItem.value, dataItem.value, dataItem.value, dataItem.value, dataItem.value, dataItem.value] }] }; chart.setOption(option); }); } } }); ``` 5. 在Vue组件的style中定义样式: ```css <style> .chart-container { width: 100%; height: 200px; overflow: hidden; } .chart-item { width: 100%; height: 100%; } .chart { width: 100%; height: 100%; } </style> ``` 这样,你就可以实现vue3-seamless-scroll无缝滚动echarts横向柱状图了。

“相关推荐”对你有帮助么?

  • 非常没帮助
  • 没帮助
  • 一般
  • 有帮助
  • 非常有帮助
提交
评论
添加红包

请填写红包祝福语或标题

红包个数最小为10个

红包金额最低5元

当前余额3.43前往充值 >
需支付:10.00
成就一亿技术人!
领取后你会自动成为博主和红包主的粉丝 规则
hope_wisdom
发出的红包
实付
使用余额支付
点击重新获取
扫码支付
钱包余额 0

抵扣说明:

1.余额是钱包充值的虚拟货币,按照1:1的比例进行支付金额的抵扣。
2.余额无法直接购买下载,可以购买VIP、付费专栏及课程。

余额充值