


option = {
xAxis: {
type: 'category',
},
yAxis: {
// type: 'value'
},
series: [
{
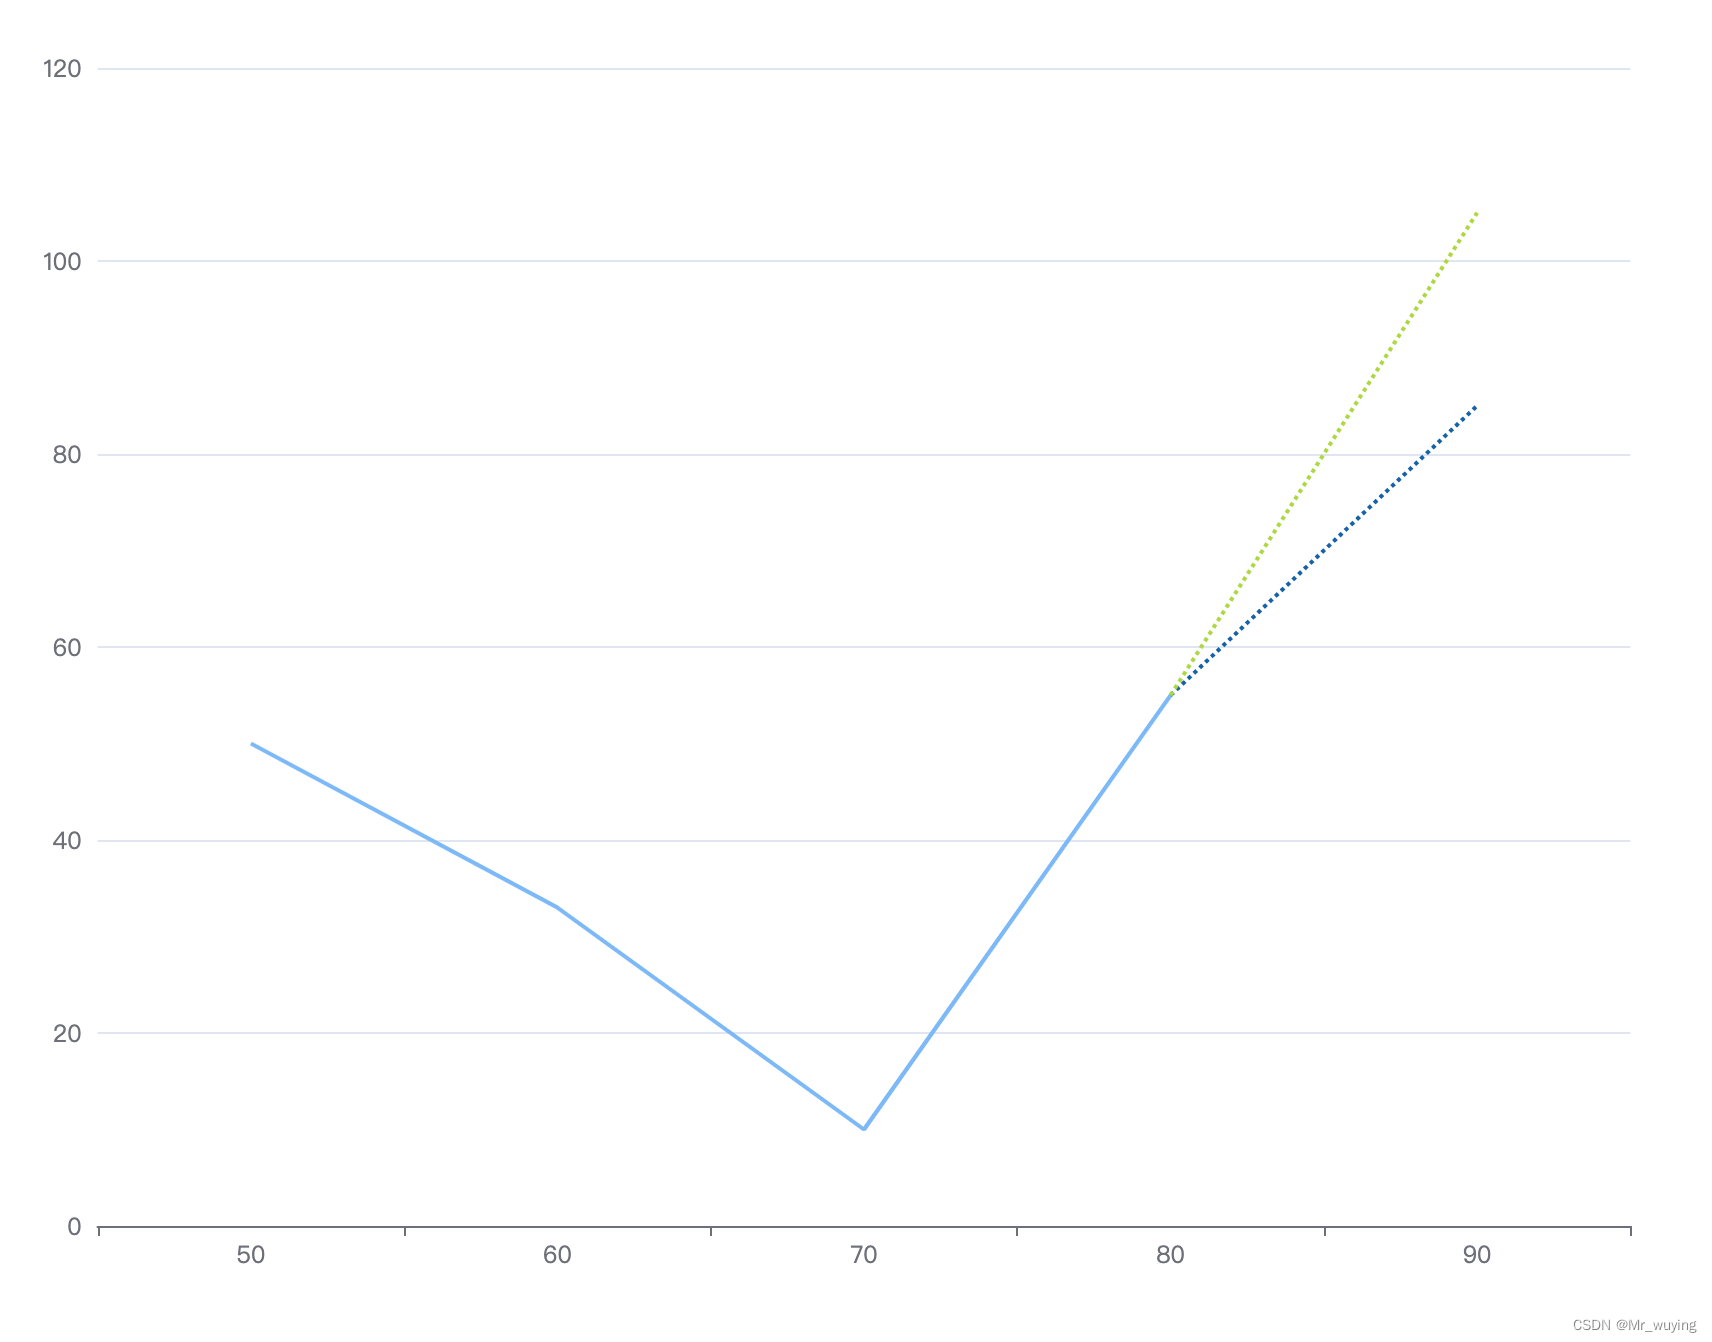
data: [[50,50],[60, 33],[70,10],[80,55]],
type: 'line',
lineStyle: {
width: 2,
color: " rgb(122, 184, 249)",
type: "solid", //'dotted'虚线 'solid'实线
},
symbol: "none", //取消折点圆圈
},
{
name: "",
type: "line",
smooth: false, //关键点,为true是不支持虚线,实线就用true
symbol: "none", //取消折点圆圈
lineStyle: {
width: 2,
color: " rgb(13, 96, 170)",
type: "dotted", //'dotted'虚线 'solid'实线
},
data: [ [80,55], [90,85]],
},{
name: "",
type: "line",
smooth: false, //关键点,为true是不支持虚线,实线就用true
symbol: "none", //取消折点圆圈
lineStyle: {
width: 2,
color: " rgb(171, 218, 49)",
type: "dotted", //'dotted'虚线 'solid'实线
},
data: [ [80,55], [90,105]],
},
]
};
两天虚线跟实线的链接点 一定要和实线最后的一个数据一样,否则就链接不起来,每条线的颜色已经样式可以单独设置,如果有更多条可以再往后加。


 334
334


 被折叠的 条评论
为什么被折叠?
被折叠的 条评论
为什么被折叠?
 到【灌水乐园】发言


