[C#][GridView][模板列]GridView中CheckBox复选框单击事件(oncheckedchanged)

实例1

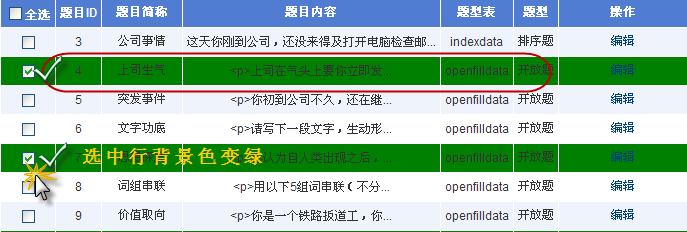
在GridView中加入 CheckBox控件,想通过单击选中出现如下图所示效果:

具体做法是:

前台GV部份省掉。只加关键的CheckBox部份。

<asp:CheckBox ID="ItemCheckBox" oncheckedchanged="ItemCheckBox_CheckedChanged" AutoPostBack="true" runat="server" />  

此代码需要注意的是:

AutoPostBack="true"

此句的效果是选中后才会执行后台的代码。

后台代码:C#

//单独选中
    protected void ItemCheckBox_CheckedChanged(object sender, EventArgs e)
    {
        CheckBox chk =(CheckBox)sender;
 
        //以下两句为 选中背景色       第一种方法通过 Parent 获得GridViewRow
        DataControlFieldCell dcf = (DataControlFieldCell)chk.Parent;    //这个对象的父类为cell
        GridViewRow gr = (GridViewRow)dcf.Parent;                   //cell的
  • 0
    点赞
  • 2
    收藏
    觉得还不错? 一键收藏
  • 0
    评论
1. GridViewcheckbox框使用: GridView框可以用来择多行记录,实现全功能等。 在GridView控件,设置的DataField属性为一个布尔型的字段,在的TemplateField添加一个Checkbox控件,并设置它的Checked属性为DataBind绑定的布尔型字段值。 示例代码: ``` <asp:GridView ID="GridView1" runat="server" AutoGenerateColumns="False"> <Columns> <asp:TemplateField> <HeaderTemplate> <asp:CheckBox ID="chkAll" runat="server" onclick="checkAll(this);" /> </HeaderTemplate> <ItemTemplate> <asp:CheckBox ID="chk" runat="server" Checked='<%# Convert.ToBoolean(Eval("IsSelected")) %>' /> </ItemTemplate> </asp:TemplateField> <asp:BoundField DataField="Name" HeaderText="Name" /> <asp:BoundField DataField="Age" HeaderText="Age" /> </Columns> </asp:GridView> ``` 2. Echarts图的使用: Echarts是一款开源的可视化图表库,支持多种图表类型,如折线图、柱状图、饼图等。 在C#使用Echarts,可以通过前端技术(如JavaScript)来实现,也可以使用Echarts.NET库来实现,前者需要在前端页面引入Echarts.js文件,后者需要在C#代码引入Echarts.NET库。 以下是使用Echarts.NET库实现柱状图的示例代码: ``` using ECharts.Entities; using ECharts.Entities.series; using Newtonsoft.Json; public partial class Demo : System.Web.UI.Page { protected void Page_Load(object sender, EventArgs e) { Chart chart = new Chart(); chart.Title.Text = "柱状图示例"; Legend legend = new Legend(); legend.Data.Add("销量"); Axis xAxis = new Axis(); xAxis.Data.Add("衬衫"); xAxis.Data.Add("羊毛衫"); xAxis.Data.Add("雪纺衫"); xAxis.Data.Add("裤子"); xAxis.Data.Add("高跟鞋"); xAxis.Data.Add("袜子"); Axis yAxis = new Axis(); SeriesBar series = new SeriesBar(); series.Name = "销量"; series.Data.Add(5); series.Data.Add(20); series.Data.Add(36); series.Data.Add(10); series.Data.Add(10); series.Data.Add(20); chart.Legend = legend; chart.XAxis = xAxis; chart.YAxis = yAxis; chart.Series.Add(series); string json = JsonConvert.SerializeObject(chart); string script = string.Format("var myChart = echarts.init(document.getElementById('chartContainer'));myChart.setOption({0});", json); Page.ClientScript.RegisterStartupScript(this.GetType(), "EchartsScript", script, true); } } ``` 在前端页面,需要添加一个div元素来显示图表,并引入Echarts.js文件和jQuery库: ``` <!DOCTYPE html> <html xmlns="http://www.w3.org/1999/xhtml"> <head> <title></title> <script src="Scripts/jquery-3.3.1.min.js"></script> <script src="Scripts/echarts.min.js"></script> </head> <body> <div id="chartContainer" style="width: 600px;height:400px;"></div> </body> </html> ```

“相关推荐”对你有帮助么?

  • 非常没帮助
  • 没帮助
  • 一般
  • 有帮助
  • 非常有帮助
提交
评论
添加红包

请填写红包祝福语或标题

红包个数最小为10个

红包金额最低5元

当前余额3.43前往充值 >
需支付:10.00
成就一亿技术人!
领取后你会自动成为博主和红包主的粉丝 规则
hope_wisdom
发出的红包
实付
使用余额支付
点击重新获取
扫码支付
钱包余额 0

抵扣说明:

1.余额是钱包充值的虚拟货币,按照1:1的比例进行支付金额的抵扣。
2.余额无法直接购买下载,可以购买VIP、付费专栏及课程。

余额充值