


import pandas as pd
import matplotlib.pyplot as plt
import numpy as np
import seaborn as sns
import warnings
warnings.filterwarnings('ignore')
plt.rcParams['font.sans-serif'] = ['SimHei'] #解决中文显示
plt.rcParams['axes.unicode_minus'] = False #解决符号无法显示
data = pd.read_csv('../data/titanic.csv')
data.head(10)
PassengerIdSurvivedPclassNameSexAgeSibSpParchTicketFareCabinEmbarked0103Braund, Mr. Owen Harrismale22.010A/5 211717.2500NaNS1211Cumings, Mrs. John Bradley (Florence Briggs Th...female38.010PC 1759971.2833C85C2313Heikkinen, Miss. Lainafemale26.000STON/O2. 31012827.9250NaNS3411Futrelle, Mrs. Jacques Heath (Lily May Peel)female35.01011380353.1000C123S4503Allen, Mr. William Henrymale35.0003734508.0500NaNS5603Moran, Mr. JamesmaleNaN003308778.4583NaNQ6701McCarthy, Mr. Timothy Jmale54.0001746351.8625E46S7803Palsson, Master. Gosta Leonardmale2.03134990921.0750NaNS8913Johnson, Mrs. Oscar W (Elisabeth Vilhelmina Berg)female27.00234774211.1333NaNS91012Nasser, Mrs. Nicholas (Adele Achem)female14.01023773630.0708NaNC
# PassengerId: 乘客ID
# Survived: 是否幸存 (0表示未幸存,1表示幸存)
# Pclass: 客舱等级 (1表示一等舱,2表示二等舱,3表示三等舱)
# Name: 乘客姓名
# Sex: 性别
# Age: 年龄(有缺失)
# SibSp: 与乘客一起登船的兄弟姐妹/配偶的数量
# Parch: 与乘客一起登船的父母/子女的数量
# Ticket: 船票号码
# Fare: 票价
# Cabin: 客舱号码(有缺失)
# Embarked: 登船港口 (C表示Cherbourg,Q表示Queenstown,S表示Southampton)(有缺失)
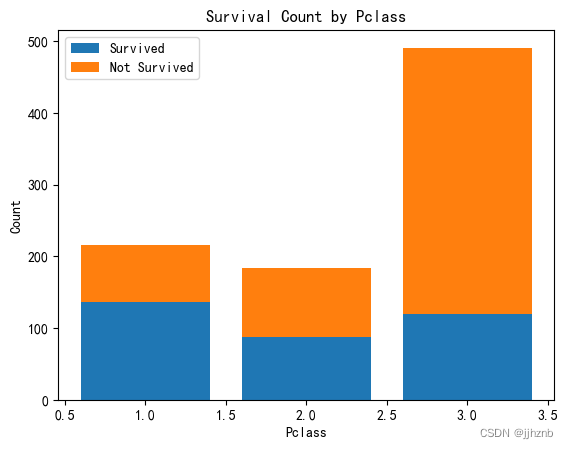
# 统计各客舱等级的幸存人数和总人数
survived_by_pclass = data.groupby('Pclass')['Survived'].sum()
# survived_by_pclass = data.groupby('Pclass')['Survived'].value_counts().unstack().fillna(0)
total_by_pclass = data.groupby('Pclass')['Survived'].count()
print(survived_by_pclass)
print(total_by_pclass)
Pclass
1    136
2     87
3    119
Name: Survived, dtype: int64
Pclass
1    216
2    184
3    491
Name: Survived, dtype: int64
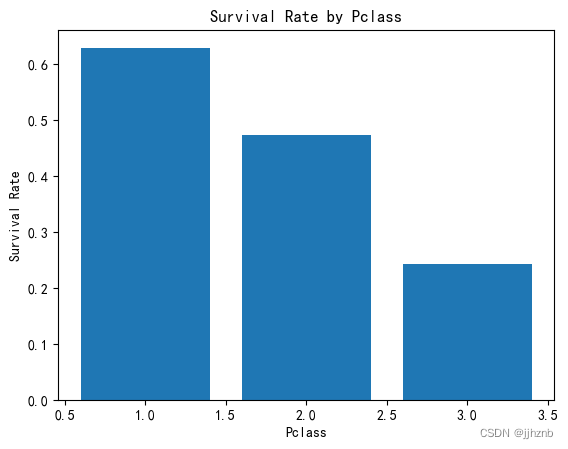
# 计算各客舱等级的生存率
survival_rate_by_pclass = survived_by_pclass / total_by_pclass
# 绘制柱状图
import matplotlib.pyplot as plt
plt.bar(survived_by_pclass.index, survived_by_pclass, label='Survived')
plt.bar(total_by_pclass.index, total_by_pclass - survived_by_pclass, bottom=survived_by_pclass, label='Not Survived')
plt.xlabel('Pclass')
plt.ylabel('Count')
plt.title('Survival Count by Pclass')
plt.legend()
plt.show()
# 绘制条形图
plt.bar(survival_rate_by_pclass.index, survival_rate_by_pclass)
plt.xlabel('Pclass')
plt.ylabel('Survival Rate')
plt.title('Survival Rate by Pclass')
plt.show()
# 统计各性别的幸存人数和总人数
survived_by_gender = data.groupby('Sex')['Survived'].sum()
total_by_gender = data.groupby('Sex')['Survived'].count()
# 计算各性别的生存率
survival_rate_by_gender = survived_by_gender / total_by_gender
# 绘制条形图
import matplotlib.pyplot as plt
plt.bar(survived_by_gender.index, survived_by_gender, label='Survived')
plt.bar(total_by_gender.index, total_by_gender - survived_by_gender, bottom=survived_by_gender, label='Not Survived')
plt.xlabel('Gender')
plt.ylabel('Count')
plt.title('Survival Count by Gender')
plt.legend()
plt.show()
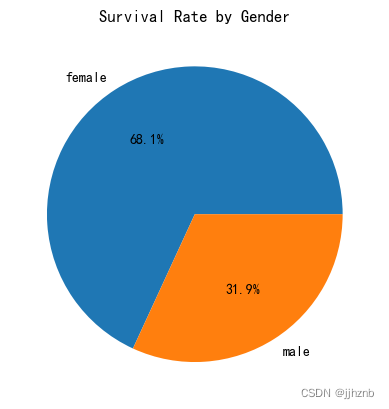
# 绘制饼图
plt.pie(survived_by_gender, labels=survived_by_gender.index, autopct='%1.1f%%')
plt.title('Survival Rate by Gender')
plt.show()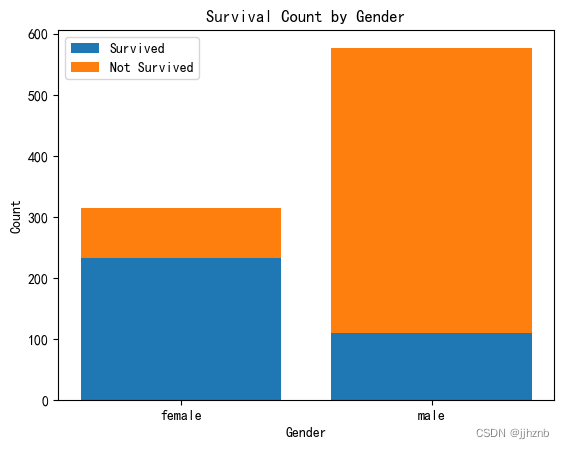
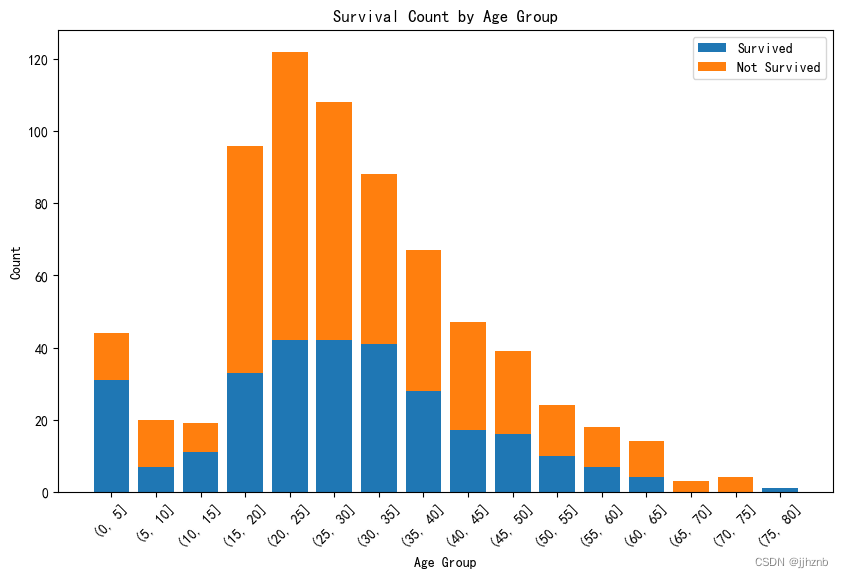
# 进行年龄分组
data['AgeGroup'] = pd.cut(data['Age'], bins=[0, 5,10,15, 20,25, 30,35, 40,45, 50,55, 60,65, 70,75, 80])
# 统计每个年龄组的幸存人数和总人数
survived_by_agegroup = data.groupby('AgeGroup')['Survived'].sum()
total_by_agegroup = data.groupby('AgeGroup')['Survived'].count()
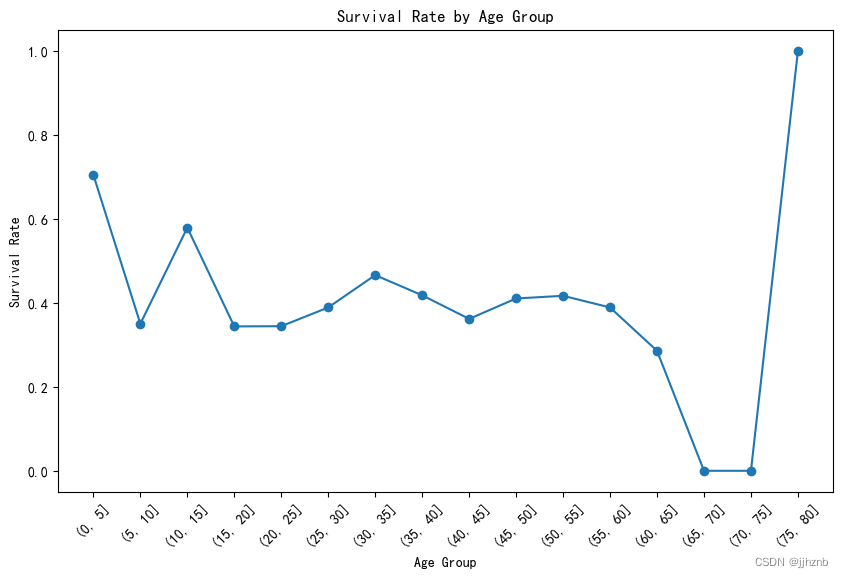
# 计算每个年龄组的生存率
survival_rate_by_agegroup = survived_by_agegroup / total_by_agegroup
plt.figure(figsize=(10, 6)) # 调整图像大小为宽度10,高度6
# 绘制条形图
import matplotlib.pyplot as plt
plt.tight_layout() # 自动调整布局
plt.xticks(rotation=45) # 逆时针旋转45度
plt.bar(survived_by_agegroup.index.astype(str), survived_by_agegroup, label='Survived')
plt.bar(total_by_agegroup.index.astype(str), total_by_agegroup - survived_by_agegroup, bottom=survived_by_agegroup, label='Not Survived')
plt.xlabel('Age Group')
plt.ylabel('Count')
plt.title('Survival Count by Age Group')
plt.legend()
plt.show()
plt.figure(figsize=(10, 6)) # 调整图像大小为宽度10,高度6
# 绘制折线图
plt.tight_layout() # 自动调整布局
plt.xticks(rotation=45) # 逆时针旋转45度
plt.plot(survival_rate_by_agegroup.index.astype(str), survival_rate_by_agegroup, marker='o')
plt.xlabel('Age Group')
plt.ylabel('Survival Rate')
plt.title('Survival Rate by Age Group')
plt.show()


 3684
3684


 被折叠的 条评论
为什么被折叠?
被折叠的 条评论
为什么被折叠?
 到【灌水乐园】发言


