


Stimulsoft BI Designer
Do you want to create reports and dashboards, but you do not need to create your application? We want to offer you a great solution – Stimulsoft Designer! All you need is to connect your data, drag it onto the template page, configure the display, and save the finished document. You can send it by Email, share it on social networks or on your Web site, otherwise at any time continue to work with it in the designer.
Stimulsoft Framework
Stimulsoft Designer is part of the unified Stimulsoft framework, which includes the engine to generate reports and analyze data, report designer, and viewer. You can create a report on the computer, continue editing it in the cloud using the online designer, and view the result on the tablet screen. All reports and dashboards have a single universal format and work on any operating system.
Explore our features in the Online Demo
One application – Unlimited opportunities
Stimulsoft Designer is a sturdy product that runs on any computer and any platform. The vast functionality will help you to implement the most daring ideas in designing reports and dashboards, both online and offline on your workstation. A single interface and approaches for creating and editing templates on various platforms significantly increase usability and productivity.
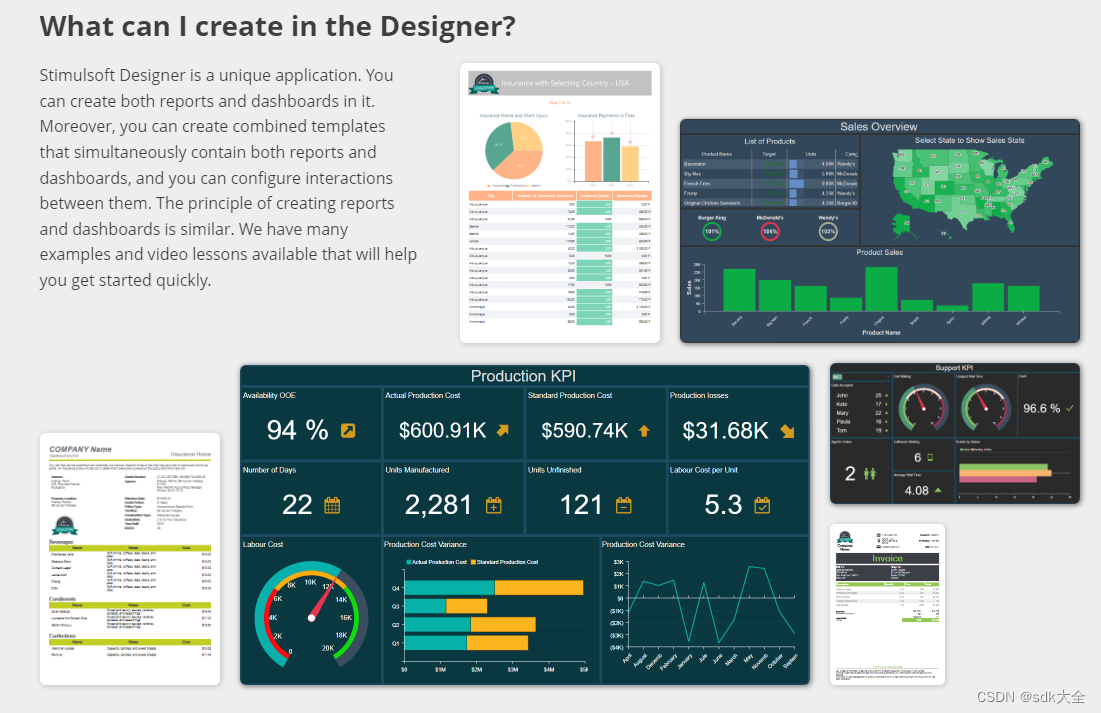
What can I create in the Designer?
Stimulsoft Designer is a unique application. You can create both reports and dashboards in it. Moreover, you can create combined templates that simultaneously contain both reports and dashboards, and you can configure interactions between them. The principle of creating reports and dashboards is similar. We have many examples and video lessons available that will help you get started quickly.
Insurance With Selecting Country
Dashboard Sales Overview
Insurance Light
Dashboard Manufacturing KPI
Dashboard Support KPI
Business Invoice
Watch video tutorials on our YouTube channel
Stimulsoft Designer for You
The designer will determine the type of license when you log in and configure your workspace to offer exactly the tools for the design of reports and dashboards that you need at the current moment.
For Developers
Build your applications, use advanced features for developers, and publish finished reports and dashboards in your projects.
For BI Creators
Connect to any data sources, easily create interactive dashboards and reports in minutes at a professional level.
View detailed information about licensing
Visualize your data
We offer you a well-selected set of components – charts, tables, barcodes, primitives, and etc. All components support styles. You may easily customize them. Also, you may create attractive reports and presentations, analyze data, and display it in a convenient and understandable form. This will help you to automate activities, accelerate taking crucial decisions, and also draw attention to your business.
Read more about working with data
Ease of use
Using Stimulsoft Designer, you can easily design reports from a simple list to multi-paged, with complex calculations, conditions, functions, and variables. In just a few clicks, you can create understandable and informative dashboards, set filters, and sorting for any element.
Report Designer is easy
This is a standalone product that does not require programming skills. It allows you to create and view reports, analyze data, and work with dashboards, export finished documents to PDF, Excel, Word, etc., save them on a local disk or in the cloud.
Maximum functionality
Stimulsoft BI Designer can easily manage with any data set - more than 30 different adapters are available, expressions and parameters in queries, grouping, sorting, data transformation. You may use various data sources in one report and dashboard. Dozens of thousands data rows is not a problem for our reporting and data analysis engine!
Professionally crafted templates
We have prepared over 100 professionally designed reports and dashboard templates that are available right in the designer. Choose the most suitable one, connect your data, change the style and settings if necessary - and immediately use it in your business! Besides, convenient wizards for creating reports are available.
Facts you should know
Stimulsoft Designer allows you to create, edit, view, print, export documents, and work with the cloud. This is a standalone application that will provide a full cycle of designing reports and dashboards, as well as further work with them. The designer uses the latest standards and technologies to analyze and
visualize data quickly.
You can use more than 50 elements to create templates – bands, charts, barcodes, tables, text components, maps, indicators, and others.
You can easily share your reports and dashboards with clients or business partners, send them by Email, or upload them to the cloud.
We have created for you more than 100 professional templates for a quick start – invoices, insurance, and personnel reports, dashboards.
The designer is easy to learn, the intuitive steps at the first start will help you quickly understand the philosophy of creating templates.
The designer speaks your language, find it in the list of interface localization, we support more than 40 languages of the world.
The designer supports many databases, including SQL, Oracle, PostgreSQL, MS Access, MongoDB, Excel, JSON, XML, OData, and others.


 360
360

 被折叠的 条评论
为什么被折叠?
被折叠的 条评论
为什么被折叠?
 到【灌水乐园】发言


