


1.引入方式
引入方式分为两种:
1-1:在 HTML 中使用 CDN 引入
// version <= 3.2
<script src="https://gw.alipayobjects.com/os/antv/pkg/_antv.g6-{$version}/build/g6.js"></script>

// version >= 3.3
<script src="https://gw.alipayobjects.com/os/lib/antv/g6/{$version}/dist/g6.min.js"></script>

// version >= 4.0
<script src="https://gw.alipayobjects.com/os/lib/antv/g6/4.3.11/dist/g6.min.js"></script>
1-2:在项目中使用 NPM 包引入
 npm install --save @antv/g6

//在需要用的 G6 的 JS 文件中导入:
import G6 from '@antv/g6';
2.创建画布
需要在 HTML 中创建一个用于容纳 G6 绘制的图的容器,通常为 div 标签。G6 在绘制时会在该容器下追加 canvas 标签,然后将图绘制在其中:
<template>
  <div class="container" id="container">
  </div>
</template>
3.数据准备
data() {
    return {
      graph: null,//初始化
      registerEdge: null,//线上的动画效果初始化
      newData: {
        nodes: [//节点
          {
            id: "node1",//元素id
            x: 100,//left
            y: 100,//top
            label: "172.1.2.3",//节点文字描述
            size: 30,//节点大小
            labelCfg: {
              position: "bottom",//label位置
            },
          },
          {
            id: "node2",
            x: 300,
            y: 200,
            color: "#40a9ff",
            label: "172.2.2.4",
            size: 30,
            labelCfg: {
              position: "bottom",
            },
          },
          {
            id: "node3",
            x: 500,
            y: 320,
            color: "#40a9ff",
            label: "172.2.2.5",
            size: 30,
            labelCfg: {
              position: "bottom",
            },
          },
        ],
        edges: [//连线
          {
            source: "node1",//源节点
            target: "node2",//目标节点
            label: "第一条",//线上的文字描述
            // style: {
            //   endArrow: true,//源节点箭头是否显示
            //   startArrow: true,//目标节点箭头是否显示
            // },
          },
          {
            source: "node1",
            target: "node3",
            label: "第二条",
            // style: {
            //   endArrow: true,
            //   startArrow: true,
            // },
          },
        ],
      },
    };
  },
4.初始化 G6
initG6() {
      const width = document.getElementById("container").scrollWidth || 800;
      const height = document.getElementById("container").scrollHeight || 800;
      // const nodes = this.getData.nodes;
      //   this.nodeEach(nodes);
      this.graph = new G6.Graph({
        // 1.画图挂载容器id
        container: "container",
        // 1.1容器宽高
        width,
        height,
        fitView: true,
        fitViewPadding: [20, 40, 50, 20],
        // 节点在默认状态下的样式配置(style)和其他配置
        defaultNode: {
          // 节点上的标签文本配置
          size: [30, 30],
          labelCfg: {
            // 节点上的标签文本样式配置
            style: {
              fill: "#000", // 节点标签文字颜色
              fontSize: 13,
            },
          },
        },
        //边默认的属性,包括边的一般属性和样式属性(style)。
        defaultEdge: {
          type: "circle-running", //配置的动画,不需要动画可以不写
          shape: "line",
          color: "#000",
          endArrow: true,
          startArrow: true,
          labelCfg: {
            autoRotate: true,
          },
          style: {
            lineWidth: 2,//线的宽度
            stroke: "#47c21f",//线的颜色
            // stroke: "#bae7ff",
          },
        },
        modes: {
          default: [
            "drag-canvas",//拖拽画布
            "zoom-canvas",//鼠标滑轮放大缩小画布
            "drag-node",//节点拖拽
            "click-select",//click-select  按住shift点击多选 需要下方配置
            "brush-select",//brush-select 按住shift滑动鼠标框选多选 需要下方配置
          ],
          //   altSelect: [//按住shift点击多选
          //     {
          //       type: "click-select",
          //       trigger: "alt",
          //     },
          //     "drag-node",
          //   ],
          altSelect: [//按住shift滑动鼠标框选多选
            {
              type: "brush-select",
              trigger: "drag",
            },
            "drag-node",
          ],
        },
      });

      // 读取 data 中的数据源到图上
      this.graph.data(this.newData);
      // 渲染图
      this.graph.render();
      this.graph.zoom(0.4);
    },
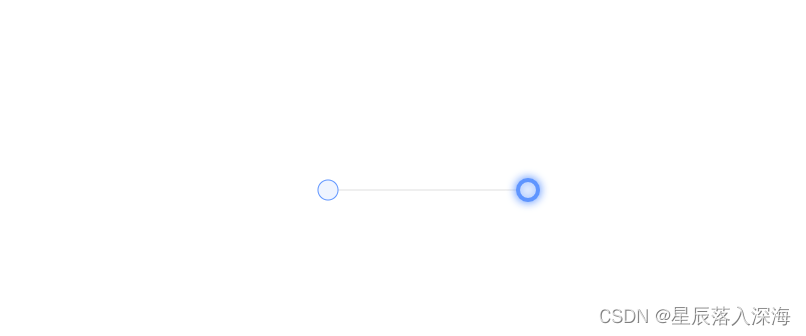
5.配置连接线上的动画效果
initEdge() {
      // return
      this.registerEdge = new G6.registerEdge(
        "circle-running",
        {
          afterDraw(cfg, group) {
            // 获取组中的第一个形状,这是边的路径=
            const shape = group.get("children")[0];
            // 边路径的起始位置
            const startPoint = shape.getPoint(0);

            // 添加蓝色圆圈形状
            const circle = group.addShape("circle", {
              attrs: {
                x: startPoint.x,
                y: startPoint.y,
                fill: "#1890ff",
                r: 3,
              },
              name: "circle-shape",
            });

            // 蓝色圆圈的动画
            circle.animate(
              (ratio) => {
                // 每个帧中的操作。比率范围从0到1,表示动画的进度。返回修改后的配置 根据比率获得边缘上的位置
                const tmpPoint = shape.getPoint(ratio);
                // 这里返回修改后的配置,这里返回x和y
                return {
                  x: tmpPoint.x,
                  y: tmpPoint.y,
                };
              },
              {
                repeat: true, // 是否重复执行动画
                duration: 3000, // 动画完成时间
              }
            );
          },
        },
        "line" // 直线
      );
    },
6.调用位置
建议放到mounted钩子函数里执行
mounted() {
    this.initEdge();
    this.initG6();
};
7.G6的监听方法
这里就举例几个常用的监听
//节点
this.graph.on("node:click", (ev) => {});//监听节点的点击方法
this.graph.on("node:mouseenter", (ev) => {});//监听节点的鼠标移入方法
this.graph.on("node:mouseleave", (ev) => {});//监听节点的鼠标移出方法

//连接线
this.graph.on("edge:click", (ev) => {});//监听连接线的点击方法
this.graph.on("edge:mouseenter", (ev) => {});//监听连接线的鼠标移入方法
this.graph.on("edge:mouseleave", (ev) => {});//监听连接线的鼠标移出方法

//画布点击方法
this.graph.on("canvas:click", (ev) => {});//监听画布的点击方法
8.进阶操作,交互功能
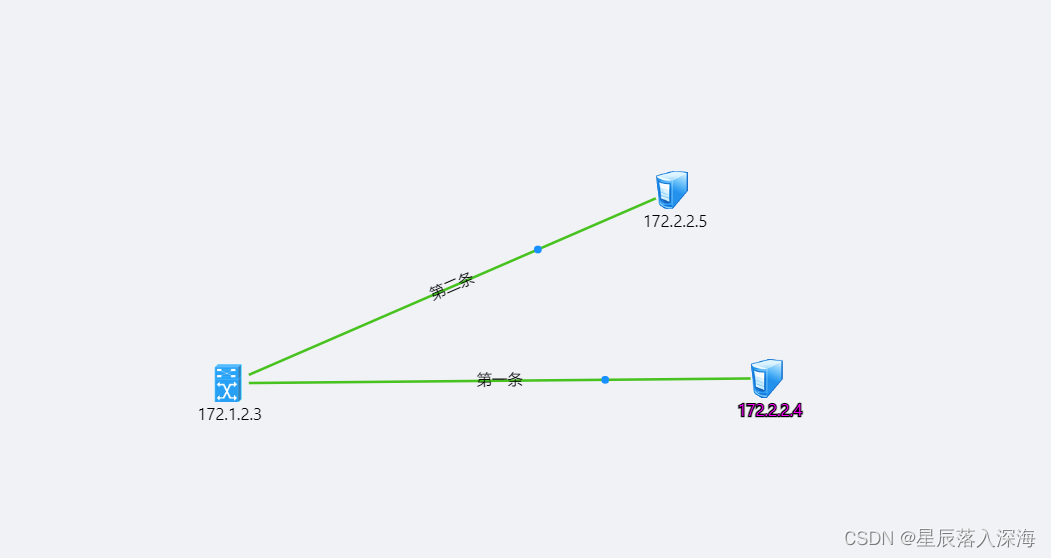
点击节点改变label字体样式
this.graph.on("node:click", (ev) => {
		//改变前先清除别的节点的点击样式
      for (let i = 0; i < this.newData.nodes.length; i++) {
        this.graph.updateItem(this.newData.nodes[i].id, {
          labelCfg: {
            style: {
              fill: "#000",
              stroke:'#000',
              lineWidth:0,
            fontSize:13
            },
          },
        });
      }
      let node = ev.item; // 被点击的节点元素
      let shape = ev.target; // 被点击的图形,可根据该信息作出不同响应,以达到局部响应效果
      this.graph.updateItem(node, {//更改节点
        labelCfg: {
          style: {
            fill: "#ff00ff",
            stroke:'#000',
            lineWidth:2,
            fontSize:13
          },
        },
      });
    });

   //点击画布时清空点击样式
   this.graph.on("canvas:click", (ev) => {
      console.log("画布", ev);
      for (let i = 0; i < this.newData.nodes.length; i++) {
        this.graph.updateItem(this.newData.nodes[i].id, {
          labelCfg: {
            style: {
              fill: "#000",
              stroke:'#000',
              lineWidth:0,
            fontSize:13
            },
          },
        });
      }
    });
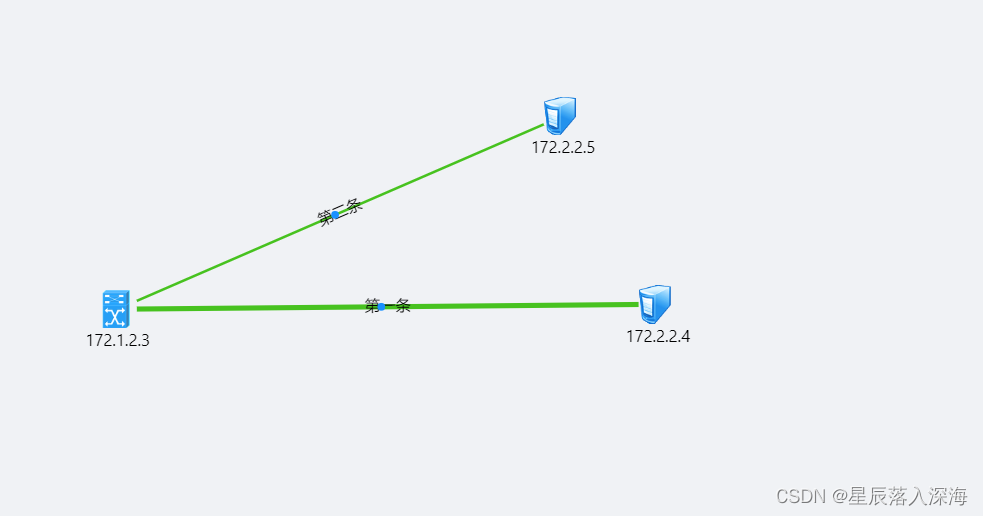
移入连接线改变线的样式
// 鼠标移入
    this.graph.on("edge:mouseenter", (ev) => {
      console.log("鼠标移入", ev);
      let node = ev.item;
      let model = node.getModel();
      model.oriLabel = model.label;
      this.graph.updateItem(node, {
          style: {
            stroke: '#47c21f',
            lineWidth:4,
          },
      });
    });
    // 鼠标移除
    this.graph.on("edge:mouseleave", (ev) => {
      let node = ev.item;
      let model = node.getModel();
      this.graph.updateItem(node, {
          style: {
            stroke: '#47c21f',
            lineWidth:2,
          },
      });
    });
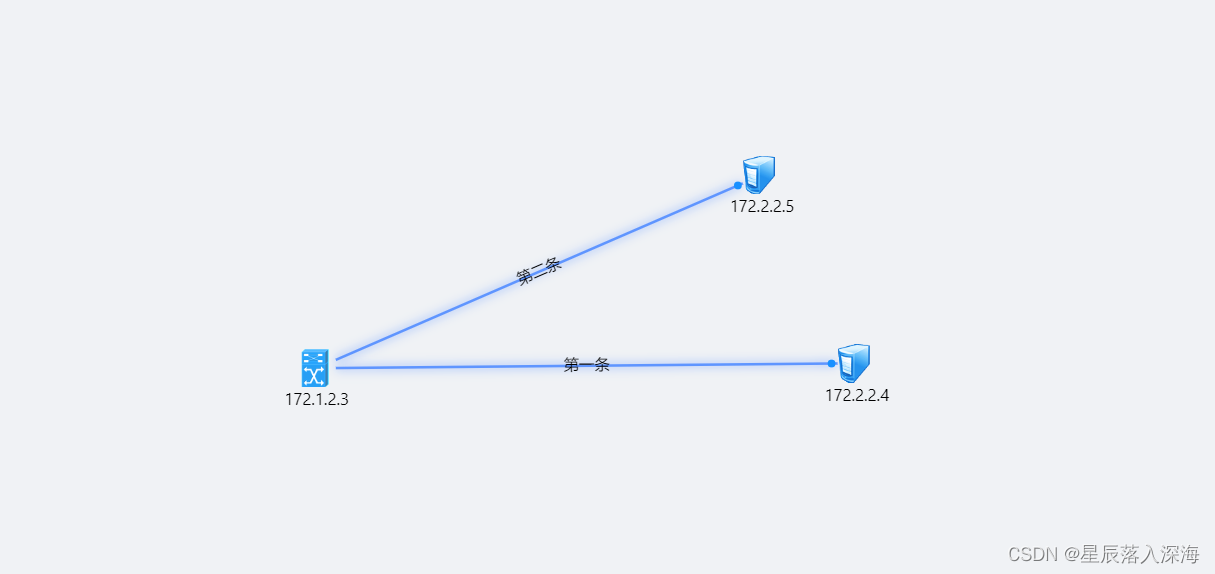
效果图
拓展节点类型
正常默认节点样式:
我这个demo用的是图片类型,需要改变节点的type
nodes: [
          {
            id: "node1",
            x: 100,
            y: 100,
            label: "172.1.2.3",
            type: "image",
            size: 30,
            img:'https://img1.baidu.com/it/u=3079431989,3499240801&fm=253&fmt=auto&app=138&f=JPEG?w=500&h=729',
            labelCfg: {
              position: "bottom",
            },
          },
      ]
**注意:**引入本地照片时需 require形式引入


 2765
2765


 被折叠的 条评论
为什么被折叠?
被折叠的 条评论
为什么被折叠?
 到【灌水乐园】发言


