


实现可拖拽的流程图
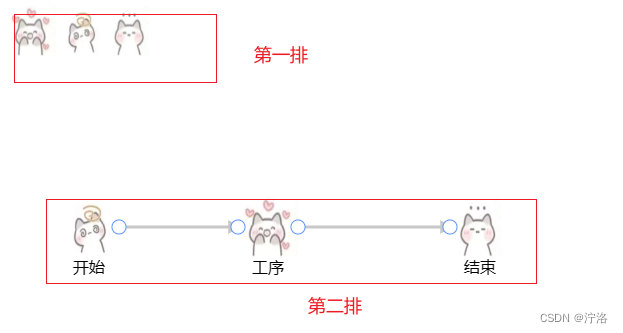
效果图:
第一排小图标是可拖拽的
第二排图标是第一排拖拽出来的
// 引入antv-G6
import G6 from '@antv/g6';
html代码
<template>
  <a-card :bordered="false">
    <div class="identification-img">
      <img src="../assets/images/1.jpg" alt="工序" class="CONTINUE_PROCESS" title="连续工序" @dragend="drag" />
      <img src="../assets/images/2.jpg" alt="开始" class="START_PROCESS" title="开始" @dragend="drag" />
      <img src="../assets/images/3.jpg" alt="结束" class="END_PROCESS" title="结束" @dragend="drag" />
    </div>
    <div class="main-content-box">
      <!-- 画布 -->
      <div id="container"></div>
    </div>
  </a-card>
</template>
添加事件,让图片可拖拽
drag(e){
      let model = {
        id: (Math.random().toFixed(9) + '').split('.')[1], //节点id,不能重复
        img: e.target.currentSrc, //自定义节点的小图标
        type: 'image',   //节点类型
        label: e.target.alt, //节点标签
        x: e.offsetX,  //节点水平方向坐标
        y: e.offsetY - 50, //节点竖直方向坐标
        //style 节点的样式,用于设置节点的外观,可以包括填充颜色、边框颜色、线宽等
        style: {
          stroke: '#000', //边框颜色,用于定义节点的边框颜色。
          fill: '#C6E5FF',  //节点类型
        },
        // labelCfg 用于定义标签文本的样式和位置,可以包括字体大小、颜色、位置偏移等
        labelCfg: {
          style: {
            fontSize: 16,//标签文本的字体大小
          },
          position: 'bottom', //标签文本的字的位置
        },
      }
      // 增加节点
      this.graph.addItem('node', model)
    },
初始化的图数据,是一个包括 nodes (节点)数组和 edges (线)数组的对象。
getInit() {
const width = container.scrollWidth
const height = container.scrollHeight || 500
let sourceAnchorIdx, targetAnchorIdx, sourceItem, targetItem
this.graph = new G6.Graph({
container: 'container',
width, //画布宽
height,//画布高
// plugins: [contextMenu], //右击菜单自定义
modes: {
// 拖拽节点和连线
default: [
'drag-node',
{
type: 'create-edge',
// 线的链接(开始)
shouldBegin: (e) => {
// avoid beginning at other shapes on the node
if (e.target && e.target.get('name') !== 'anchor-point') return false
sourceItem = e.item
sourceAnchorIdx = e.target.get('anchorPointIdx')
e.target.set('links', e.target.get('links') + 1) // cache the number of edge connected to this anchor-point circle
return true
},
// 线的链接(结束)
shouldEnd: (e) => {
// avoid ending at other shapes on the node
if (e.target && e.target.get('name') !== 'anchor-point') return false
targetItem = e.item
targetAnchorIdx = e.target.get('anchorPointIdx')
e.target.set('links', e.target.get('links') + 1) // cache the number of edge connected to this anchor-point circle
return true
// if (this.checkEdge(sourceItem, targetItem)) {
// if (e.target) {
// targetAnchorIdx = e.target.get('anchorPointIdx')
// e.target.set('links', e.target.get('links') + 1) // cache the number of edge connected to this anchor-point circle
// return true
// }
// targetAnchorIdx = undefined
// return false
// }
return false
},
},
],
},
defaultNode: {
size: [60, 60],
type: 'image',
img: require('../assets/images/start.jpeg'),
color: '#ffffff',
style: {
// lineWidth: 20,
stroke: '#000',
fill: '#C6E5FF',
// radius: 5
},
labelCfg: {
style: {
fontSize: 16,
},
position: 'bottom',
},
anchorPoints: [
[0.5, 0],
[1, 0.5],
[0.5, 1],
[0, 0.5],
],
},
defaultEdge: {
type: 'polyline',
size: 3, //工序间的线的粗细
color: '#c8c8c8',
style: {
endArrow: {
path: 'M 0,0 L 8,4 L 8,-4 Z',
fill: '#c8c8c8',
},
lineAppendWidth: 2, //边的击中范围
lineWidth: 3, //边阴影大小
radius: 5,
},
},
})
this.graph.render()
G6.registerNode(
'image',
{
// draw anchor-point circles according to the anchorPoints in afterDraw
afterDraw(cfg, group) {
const bbox = group.getBBox()
bbox.height = 60
const anchorPoints = this.getAnchorPoints(cfg)
anchorPoints.forEach((anchorPos, i) => {
group.addShape('circle', {
attrs: {
r: 7, //工序之间连接点的大小
x: bbox.x + bbox.width * anchorPos[0],
y: bbox.y + bbox.height * anchorPos[1],
fill: '#fff',
stroke: '#5F95FF',
},
name: `anchor-point`, // the name, for searching by group.find(ele => ele.get('name') === 'anchor-point')
anchorPointIdx: i, // flag the idx of the anchor-point circle
links: 0, // cache the number of edges connected to this shape
visible: false, // invisible by default, shows up when links > 1 or the node is in showAnchors state
})
})
},
getAnchorPoints(cfg) {
return (
cfg.anchorPoints || [
[0, 0.5],
[0.33, 0],
[0.66, 0],
[1, 0.5],
[0.33, 1],
[0.66, 1],
]
)
},
// response the state changes and show/hide the link-point circles
setState(name, value, item) {
if (name === 'showAnchors') {
const anchorPoints = item.getContainer().findAll((ele) => ele.get('name') === 'anchor-point')
anchorPoints.forEach((point) => {
if (value || point.get('links') > 0) point.show()
else point.hide()
})
}
},
},
'image'
)
// 鼠标移入显示连接线的四个点
this.graph.on('node:mouseenter', (e) => {
this.graph.setItemState(e.item, 'showAnchors', true)
})
// 鼠标移出隐藏连接线的四个点
this.graph.on('node:mouseleave', (e) => {
this.graph.setItemState(e.item, 'showAnchors', false)
})
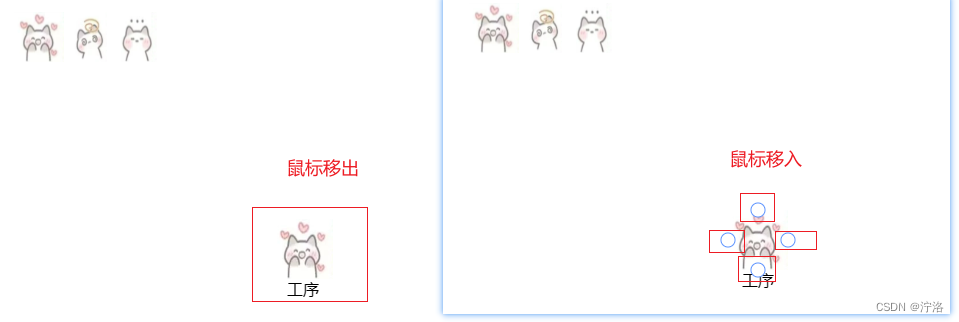
},如图所示
图一是鼠标移出隐藏连接点,图二是鼠标移入显示连接点
  // 鼠标移入显示连接线的四个点
      this.graph.on('node:mouseenter', (e) => {
        this.graph.setItemState(e.item, 'showAnchors', true)
      })
      // 鼠标移出隐藏连接线的四个点
      this.graph.on('node:mouseleave', (e) => {
        this.graph.setItemState(e.item, 'showAnchors', false)
      })


 8210
8210


 被折叠的 条评论
为什么被折叠?
被折叠的 条评论
为什么被折叠?
 到【灌水乐园】发言


