


接上一篇
3.7 mysql监控(process_exporter)
3.7.1解压安装
tar -zxvf mysqld_exporter-0.14.0.linux-amd64.tar.gz  -C /usr/local/
cd /usr/local/  && ln -s mysqld_exporter-0.14.0.linux-amd64 mysqld_exporter
3.7.2mysql新建用户
CREATE USER 'exporter'@'localhost' IDENTIFIED  WITH mysql_native_password BY 'Prometheus965' WITH MAX_USER_CONNECTIONS 10;
GRANT PROCESS, REPLICATION CLIENT, SELECT ON *.* TO 'exporter'@'localhost';
3.7.3编辑配置文件
vi  /usr/local/mysqld_exporter/.my.cnf
[client]
user=exporter
password=Prometheus965
3.7.3启动服务
vim /etc/systemd/system/mysqld_exporter.service
[Unit]
Description=mysqld_exporter
After=network.target

[Service]
Type=simple
Environment=DATA_SOURCE_NAME=exporter:Prometheus965@(localhost:3306)/
ExecStart=/usr/local/mysqld_exporter/mysqld_exporter --config.my-cnf=/usr/local/mysqld_exporter/.my.cnf --web.listen-address=:9104
ExecStop=/usr/bin/pkill -f mysqld_exporter

[Install]
WantedBy=multi-user.target
# 重载systemd 配置,修改完systemd配置文件后需重载才会生效。
systemctl daemon-reload
# 设置服务开机启动
systemctl enable mysqld_exporter
# 启动服务
systemctl start mysqld_exporter
# 查看服务状态
systemctl status mysqld_exporter
添加prometheus.yml配置文件
  - job_name: 'mysqld_exporter'
    static_configs:
      - targets: ['192.168.1.134:9104']
        labels:
          app: mysqld_exporter
          node: node_01
          role: mysqld_exporter
          instance: node_01
3.7.4 grafana页面监控
添加7362
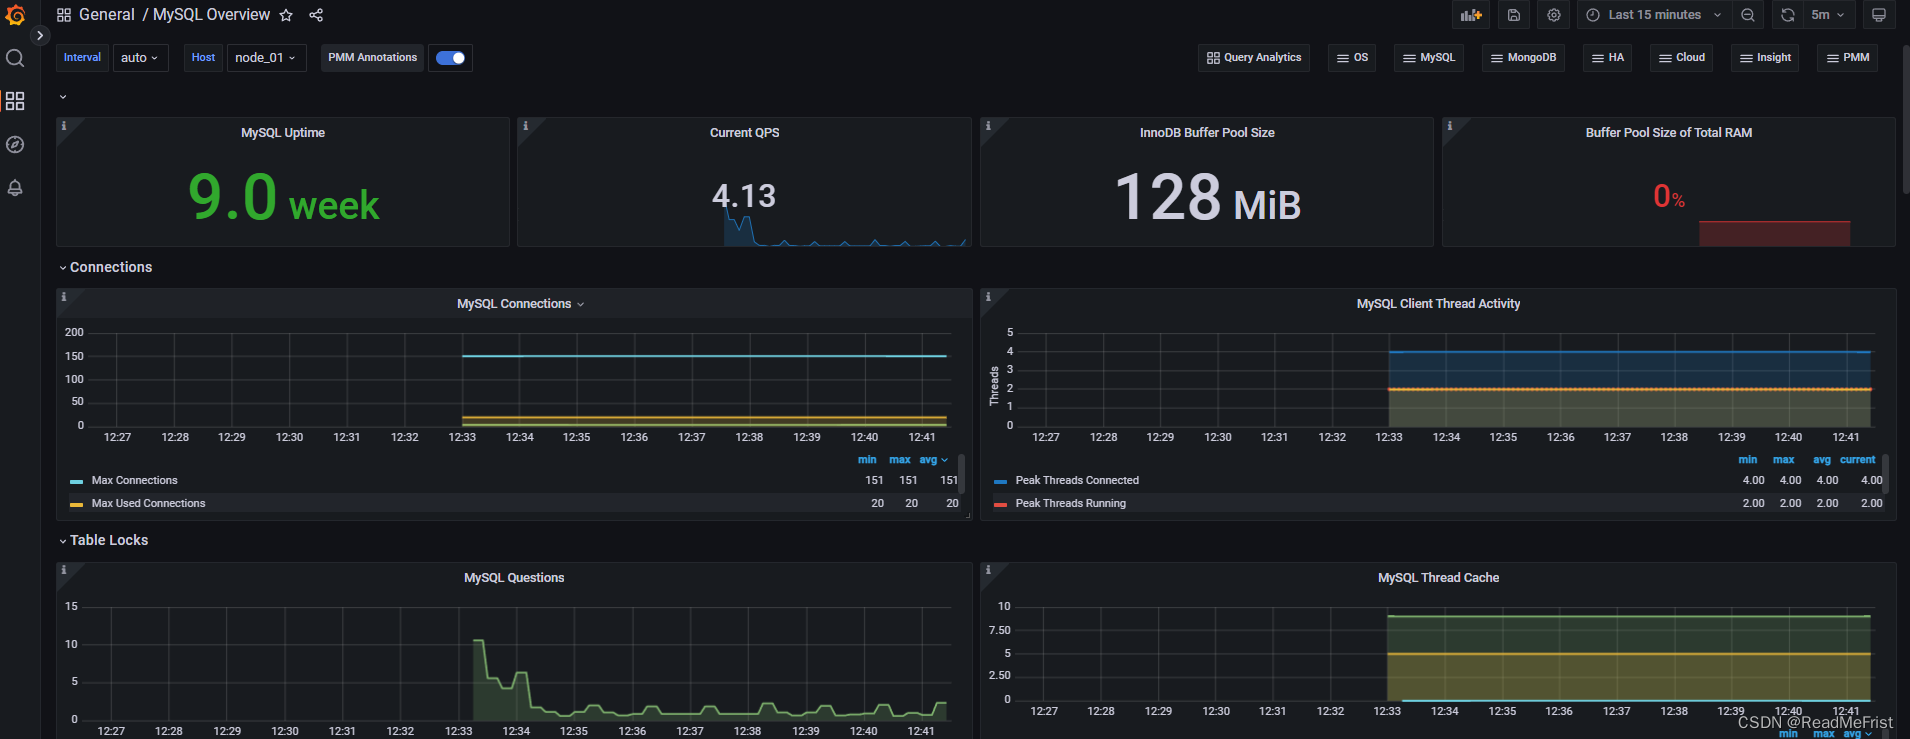
3.7.4 添加监控摸版
进入目录 cd /usr/local/prometheus/rules
cat mysql_rules.yml
groups:
- name: mysql_rules
  rules:
  - record: mysql:status
    expr: mysql_up{instance=~".*9104"}
  - record: mysql:uptime
    expr: mysql_global_status_uptime{job="mysqld_exporter"}
  - record: mysql:mysql_threads_connected
    expr: mysql_global_status_threads_connected{job="mysqld_exporter"}
  - record: mysql:mysql_threads_running
    expr: mysql_global_status_threads_running{job="mysqld_exporter"}
  - record: mysql:mysql_aborted_connects
    expr: increase(mysql_global_status_aborted_connects{job="mysqld_exporter"}[2m])
  - record: mysql:mysql_slow_queries
    expr: increase(mysql_global_status_slow_queries{job="mysqld_exporter"}[2m])
  - record: mysql:mysql_table_locks
    expr: increase(mysql_global_status_table_locks_waited{job="mysqld_exporter"}[2m])
  - record: mysql:mysql_qps
    expr: rate(mysql_global_status_queries{job="mysqld_exporter"}[2m])
cat  mysql_alert_rule.yml
groups:

- name: mysql_alerts

  rules:

  - alert: MySQL_Down_Alert

    expr: mysql:status==0

    for: 1m

    labels:

      metric_type: db_monitor

      resource: db

      severity: critical

    annotations:

      summary: 主机 {{ $labels.nodename }} 数据库 出现异常!

      description: 主机 {{ $labels.nodename }} 上的 {{ $labels.job }} 可能存在异常,请检查!

  - alert: MySQL_uptime_Alert

    expr: mysql:uptime<1

    for: 1m

    labels:

      metric_type: db_monitor

      resource: db

      severity: critical

    annotations:

      summary: 主机 {{ $labels.nodename }} 数据库 出现异常!

      description: 主机 {{ $labels.nodename }} 数据库状态异常,请检查!

  - alert: MySQL_threads_connected_Alert

    expr: mysql:mysql_threads_connected > 100

    for: 1m

    labels:

      metric_type: db_monitor

      resource: db

      severity: critical

    annotations:

      summary: 主机 {{ $labels.nodename }} 上的数据库指标 threads_connected 超出阈值!

      description: 主机 {{ $labels.nodename }} 上的数据库指标 threads_connected 超出阈值,当前值为{{humanize $value}},请检查!

  - alert: MySQL_threads_running_Alert

    expr: mysql:mysql_threads_running > 200

    for: 1m

    labels:

      metric_type: db_monitor

      resource: db

      severity: critical

    annotations:

      summary: 主机 {{ $labels.nodename }} 上的数据库指标 threads_running 超出阈值!

      description: 主机 {{ $labels.nodename }} 上的数据库指标 threads_connected 超出阈值,当前值为{{humanize $value}},请检查!

  - alert: MySQL_aborted_connects_Alert

    expr: mysql:mysql_aborted_connects > 10

    for: 1m

    labels:

      metric_type: db_monitor

      resource: db

      severity: critical

    annotations:

      summary: 主机 {{ $labels.nodename }} 上的数据库指标 aborted_connects 超出阈值!

      description: 主机 {{ $labels.nodename }} 上的数据库指标 aborted_connects 超出阈值,当前值为{{humanize $value}},请检查!

  - alert: MySQL_slow_queries_Alert

    expr: mysql:mysql_slow_queries > 1

    for: 1m

    labels:

      metric_type: db_monitor

      resource: db

      severity: critical

    annotations:

      summary: 主机 {{ $labels.nodename }} 上的数据库指标 slow_queries 超出阈值!

      description: 主机 {{ $labels.nodename }} 上的数据库指标 slow_queries 超出阈值,当前值为{{humanize $value}},请检查!

  - alert: MySQL_table_locks_Alert

    expr: mysql:mysql_table_locks > 1

    for: 1m

    labels:

      metric_type: db_monitor

      resource: db

      severity: critical

    annotations:

      summary: 主机 {{ $labels.nodename }} 上的数据库指标 table_locks 超出阈值!

      description: 主机 {{ $labels.nodename }} 上的数据库指标 table_locks 超出阈值,当前值为{{humanize $value}},请检查!

  - alert: MySQL_qps_Alert

    expr: mysql:mysql_qps > 500

    for: 1m

    labels:

      metric_type: db_monitor

      resource: db

      severity: critical

    annotations:

      summary: 主机 {{ $labels.nodename }} 上的数据库指标 qps 超出阈值!

      description: 主机 {{ $labels.nodename }} 上的数据库指标 qps 超出阈值,当前值为{{humanize $value}},请检查!
重启服Prometheus服务完成配置
3.8 redis监控(redis_exporter)
3.8.1 解压安装
tar -zxvf redis_exporter-v1.43.1.linux-amd64.tar.gz  -C /usr/local/
cd /usr/local/ &&  ln -s redis_exporter-v1.43.1.linux-amd64  redis_exporter
3.8.2 解压安装
3.8.3启动服务
vim /etc/systemd/system/redis_exporter.service
[Unit]
Description=redis_exporter
Documentation=https://github.com/oliver006/redis_exporter
After=network.target
[Service]
Type=simple
User=prometheus
ExecStart=/usr/local/redis_exporter/redis_exporter -redis.addr  192.168.1.134:6379 -redis.password 123456
Restart=on-failure
[Install]
WantedBy=multi-user.target
$ systemctl daemon-reload
$ systemctl start redis_exporter
$ systemctl status redis_exporter
$ systemctl enable redis_exporter
$ ss -tln | grep 9121
3.8.4修改prometheus监控配置
vim /usr/local/prometheus/prometheus.yml 添加
  - job_name: 'redis'
    scrape_interval: 10s
    static_configs:
      - targets: ['192.168.1.134:9121']
        labels:
          instance: node_01
重启prometheus服务
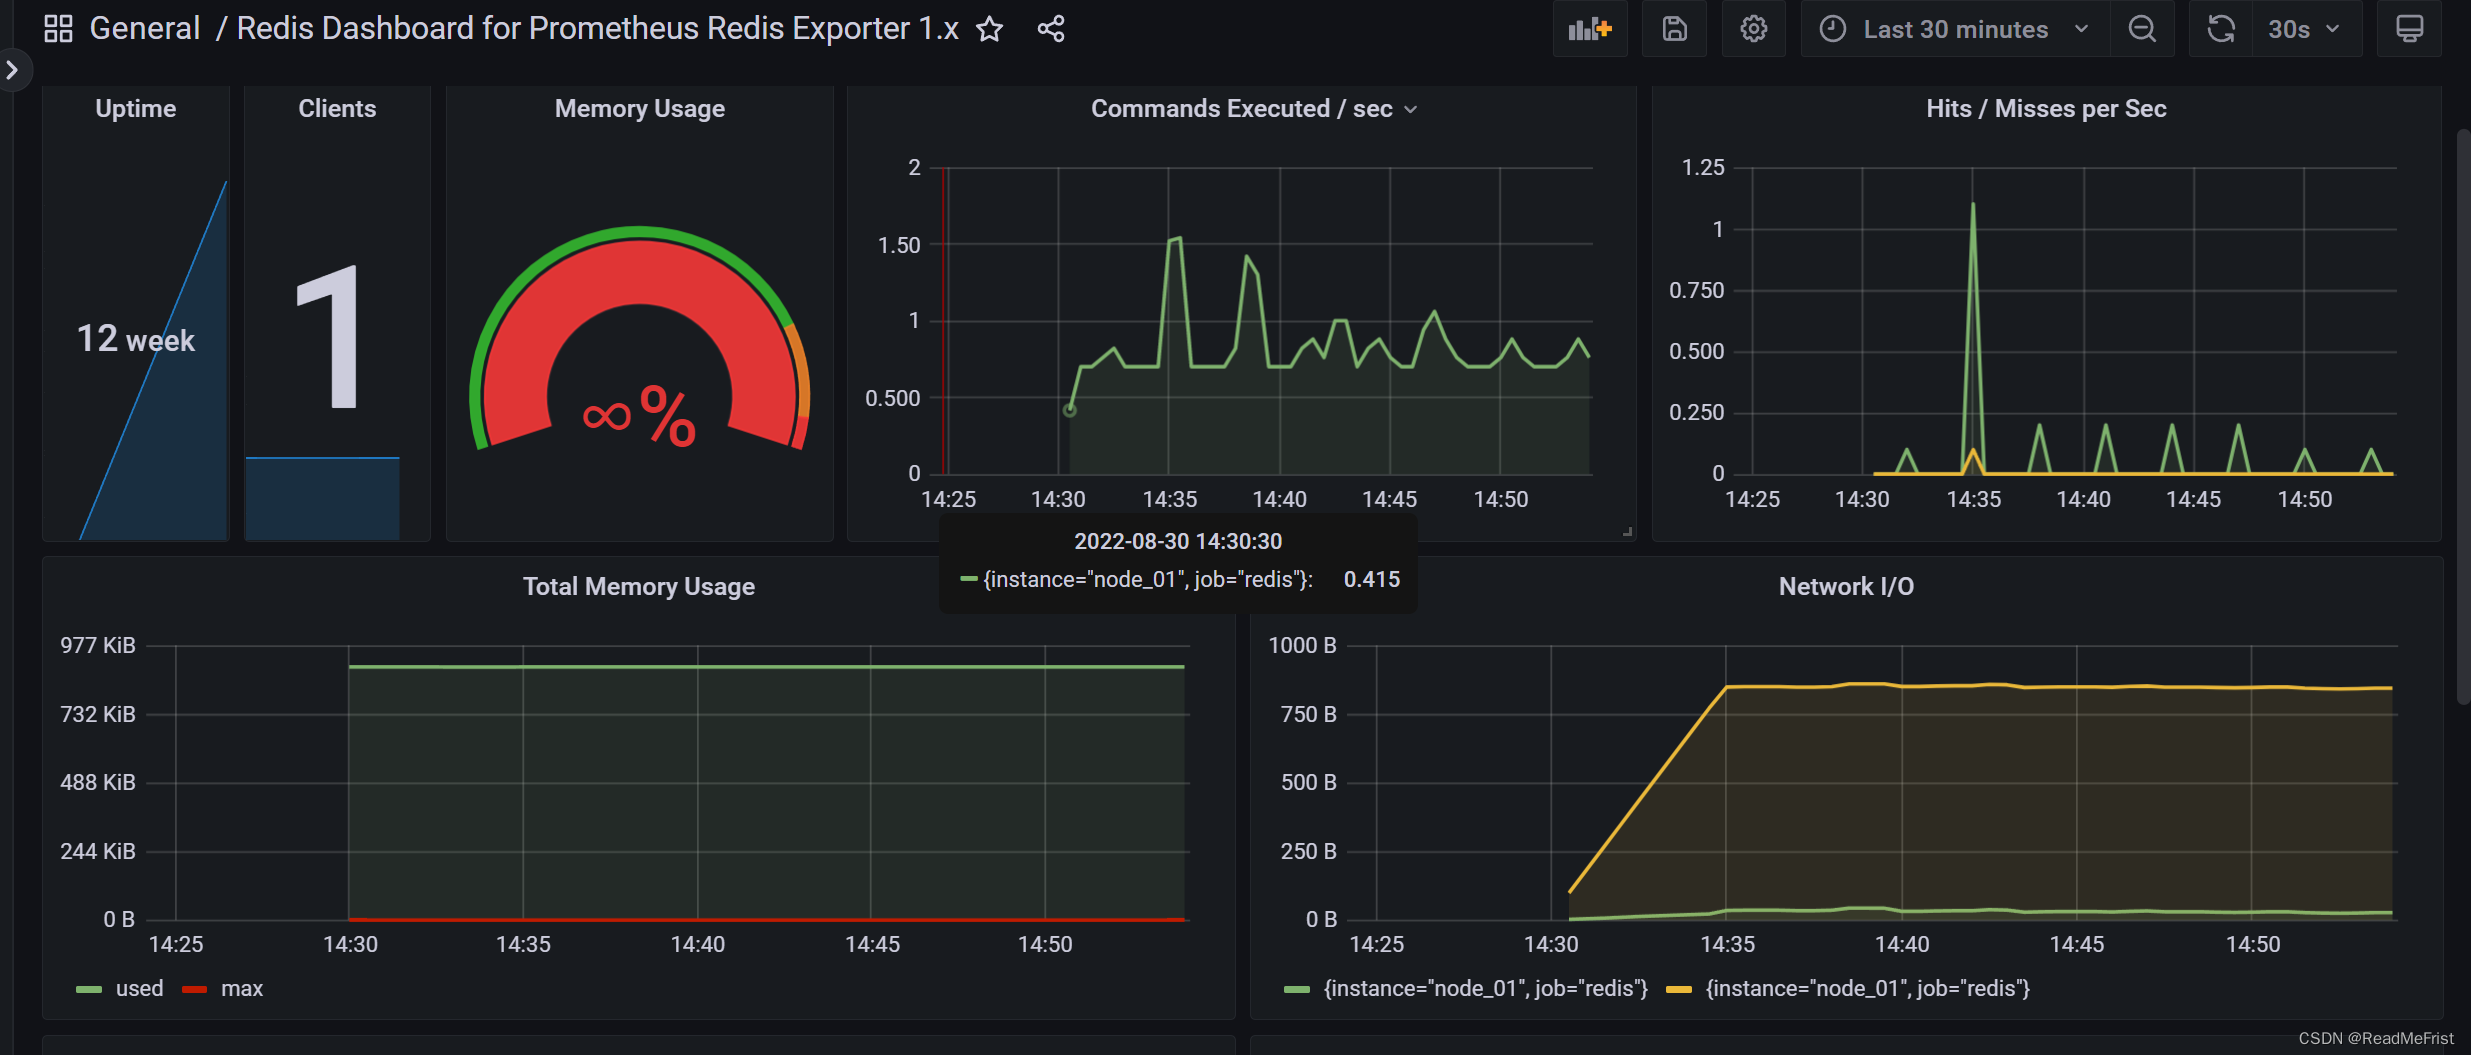
3.8.5 grafana页面监控
模板地址为:https://grafana.com/grafana/dashboards/11692
3.9 Nginx监控(nginx-vts-exporter)
3.9.1 Nginx相关模块nginx-module-vts添加
下载
cd  /usr/local/src
git clone https://github.com/vozlt/nginx-module-vts.git
nginx编译添加新模块
参考https://blog.csdn.net/weixin_42257984/article/details/123507245
/usr/local/tengine/sbin/nginx -V查看原有参数,最好添加添加–add-module=/usr/local/src/nginx-module-vts,参考编译参数
--prefix=/usr/local/tengine2.3.3 --with-ld-opt=-Wl,-rpath,/usr/local/luajit/lib --http-log-path=/home/logs/access.log --error-log-path=/home/logs/error.log --pid-path=/home/logs/nginx.pid --lock-path=/home/logs/nginx.lock --with-http_flv_module --with-http_mp4_module --with-http_gzip_static_module --with-http_stub_status_module --with-http_ssl_module --with-md5=/usr/lib --with-http_realip_module --with-pcre=/usr/local/src/new/pcre-8.39 --with-http_sub_module --with-http_image_filter_module --http-client-body-temp-path=/dev/shm/nginx_temp/client_body --http-proxy-temp-path=/dev/shm/nginx_temp/proxy --http-fastcgi-temp-path=/dev/shm/nginx_temp/fastcgi --http-uwsgi-temp-path=/dev/shm/nginx_temp/uwsgi --http-scgi-temp-path=/dev/shm/nginx_temp/scgi --with-openssl=/usr/local/src/new/openssl-1.0.2 --add-module=modules/ngx_http_lua_module --add-module=/usr/local/src/new/ngx_devel_kit-0.3.0 --add-module=/usr/local/src/new/ngx_cache_purge-2.3 --add-module=modules/ngx_http_concat_module --add-module=modules/ngx_http_footer_filter_module --add-module=modules/ngx_http_upstream_check_module --with-http_geoip_module --add-module=/usr/local/src/nginx-upload-module-master --add-module=/usr/local/src/nginx-module-vts
执行make,但不要执行make install,然后替换nignx文件
编辑 nginx 配置文件,参考文档:https://github.com/vozlt/nginx-module-vts#installation
http {
    vhost_traffic_status_zone;
    vhost_traffic_status_filter_by_host on;

    ...

    server {

        ...

        location /status {
            vhost_traffic_status_display;
            vhost_traffic_status_display_format html;
            allow 127.0.0.1;
            deny all;
        }
    }
}
配置解释
1、vhost_traffic_status_zone; 是必填项
2、vhost_traffic_status_filter_by_host on; 即打开vhost过滤,开启此功能,在nginx配置有多个server_name的情况下
会根据不同的server_name进行流量的统计,否则默认会把流量全部计算到第一个server_name上
3、 在不想统计流量的server区域可以使用 vhost_traffic_status off; 禁止
3.9.2 nginx-vts-exporter安装
解压安装
tar -zxvf nginx-vts-exporter-0.10.3.linux-amd64.tar.gz  -C /usr/local/
cd  /usr/local/ &&  ln -s nginx-vts-exporter-0.10.3.linux-amd64 nginx-vts-exporter
设置启动
vim /etc/systemd/system/nginx-vts-exporter.service
[Unit]
Description=nginx-vts-exporter
Documentation=https://github.com/hnlq715/nginx-vts-exporter
After=network.target

[Service]
Type=simple
ExecStart=/usr/local/nginx-vts-exporter/nginx-vts-exporter \
    -nginx.scrape_uri=http://localhost/status/format/json \
    -telemetry.address=:9913 \
    -nginx.scrape_timeout=5
ExecStop=/bin/kill -s TERM $MAINPID
Restart=on-failure

[Install]
WantedBy=multi-user.target
curl http://localhost/status/format/json 是否正常进行调试
$ systemctl daemon-reload
$ systemctl start nginx-vts-exporter
$ systemctl status nginx-vts-exporter
$ systemctl enable nginx-vts-exporter
添加prometheus配置文件
  - job_name: 'nginx_1'
    scrape_interval: 30s
    static_configs:
      - targets: ['192.168.1.134:9913']
        labels:
          instance: node_01
重启 systemctl restart prometheus
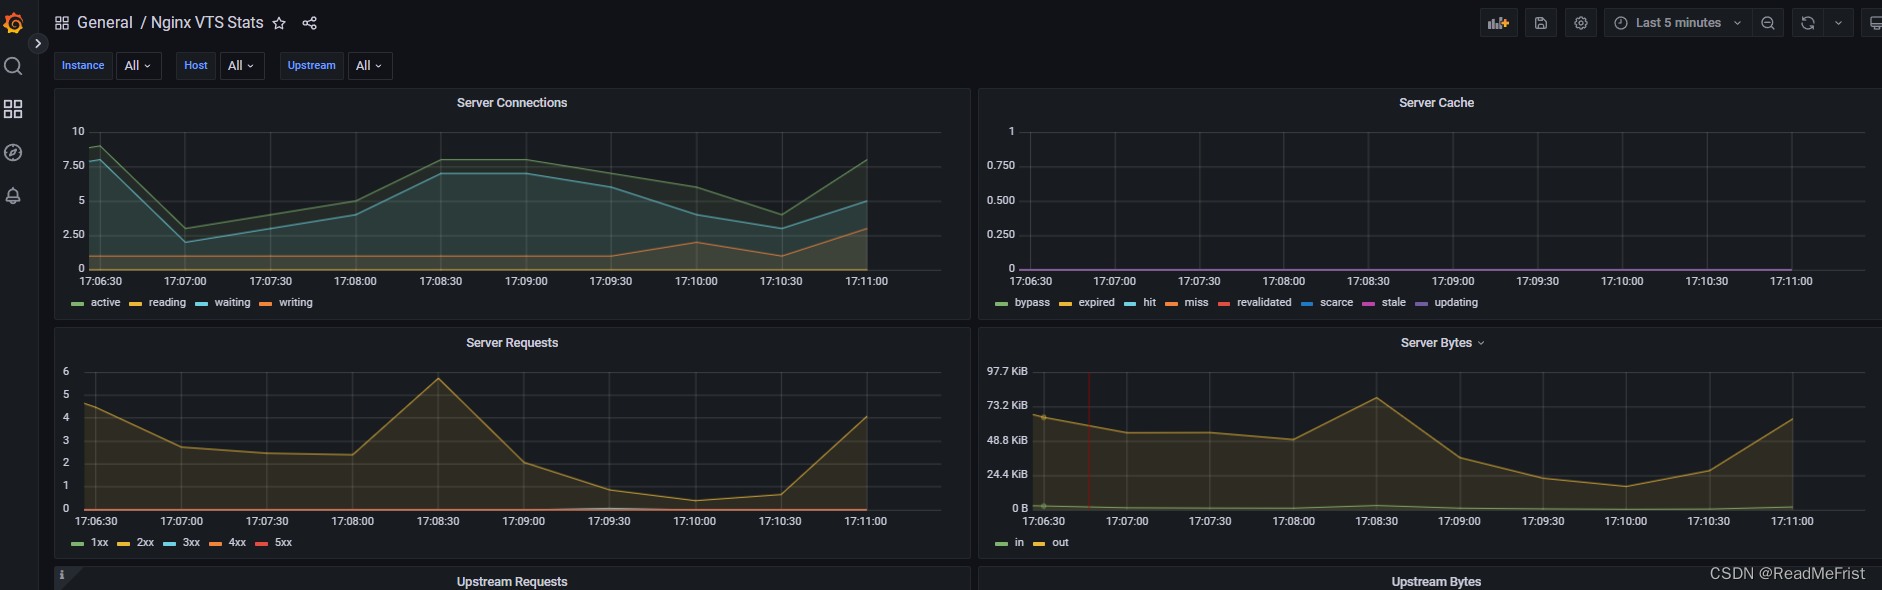
3.9.3 nginx-vts-exporter安装
https://grafana.com/grafana/dashboards/2949-nginx-vts-stats/
添加报警
cat /usr/local/prometheus/rules/www500.yml
groups:
- name: 123.net_500报警
  rules:
  - alert: 123.net_500报警
    expr:  irate(nginx_server_requests{  host=~".*123.net",code="5xx"}[3m]) > 0
    for: 3m
    labels:
      severity: warning
    annotations:
      summary: "123.net 500报警"
      description: "123.net 500报警 (当前值:{{ $value }}%)"
3.10 监控docker(cAdvisor)
可以参考连接
https://blog.csdn.net/weixin_43815140/article/details/119730821
4 PrometheusAlert监控报警
4.1 PrometheusAlert 安装
cd /usr/local/PrometheusAlert/
wget https://github.com/feiyu563/PrometheusAlert/releases/download/v4.8.1/linux.zip && unzip linux.zip && cd linux/
企业微信机器人相关配置:
cat /usr/local/PrometheusAlert/linux/conf/app.conf

#---------------------↓webhook-----------------------
#是否开启微信告警通道,可同时开始多个通道0为关闭,1为开启
open-weixin=1
#默认企业微信机器人地址
wxurl=https://qyapi.weixin.qq.com/cgi-bin/webhook/send?key=xxxxx
如何使用
以Prometheus配合自定义模板为例:
Prometheus配置参考:
cat /usr/local/alertmanager/alertmanager.yml
global:
  resolve_timeout: 5m
route:
  group_by: ['instance']
  group_wait: 10s
  group_interval: 10s
  repeat_interval: 10m
  receiver: 'web.hook.prometheusalert'
receivers:
- name: 'web.hook.prometheusalert'
  webhook_configs:
  - url: 'http://[prometheusalert_url]:8080/prometheusalert?type=wx&tpl=prometheus-wx&wxurl=微信机器人地址,微信机器人地址2&at=zhangsan,lisi'
4.2 启动
vim /etc/systemd/system/PrometheusAlert.service
[Unit]
Description=PrometheusAlert
After=network.target

[Service]
Type=simple
WorkingDirectory=/usr/local/PrometheusAlert/linux
ExecStart=/usr/local/PrometheusAlert/linux/PrometheusAlert
ExecStop=/usr/bin/pkill -f PrometheusAlert

[Install]
WantedBy=multi-user.target
# 重载systemd 配置,修改完systemd配置文件后需重载才会生效。
systemctl daemon-reload
# 设置服务开机启动
systemctl enable PrometheusAlert
# 启动服务
systemctl start PrometheusAlert
# 查看服务状态
systemctl status PrometheusAlert
访问地址http://ip:8080/ 登录账号密码查看app.conf配置


 2860
2860


 被折叠的 条评论
为什么被折叠?
被折叠的 条评论
为什么被折叠?
 到【灌水乐园】发言


