


Taro小程序引入echarts
1.taro项目的建立和运行可以参考:taro官方文档
目前taro已经升级到3.0版本。
2.echarts下载方式:
(1)在官网进行下载,之后将文件放置在项目的src目录下echarts官网地址
也可以在官网进行定制化下载,小程序本身由于代码包大小限制,引入echarts后很容易超出打包限制,定制化下载可以很好的解决这一问题。

(2)npm install echarts
具体实现:
1.将echarts图表部分封装在组件中,方便图表复用和管理。commoncomponents下的linechart是用于渲染图表的组件,alldata是主页面。

2.组件中引入echarts,
import * as echarts from "../../ec-canvas/echarts";
//组件的配置以及data初始化
config = {
   usingComponents: {
     "ec-canvas": "../../ec-canvas/ec-canvas"
   }
 }
 constructor(props){
    super(props);
    this.state = {
      ec:{
        lazyLoad:true
      }
    }
  }
//render函数中需要对echarts进行初始化,注册ref实例
render(){
    return(
      <ec-canvas
        ref={this.refChart}
        canvasId="mychart-area"
        ec={this.state.ec}
        type='2d'
      />
    )
  }
refChart = node => (this.Chart = node);
3.组件中需要注册一个初始方法用于挂载我们的this.Chart,方便外界调用和初始化echarts实例,
refresh(XzhouData,ylineData) {
    this.Chart.init((canvas, width, height, dpr) => {
      const chart = echarts.init(canvas, null, {
        width: width,
        height: height,
        devicePixelRatio: dpr //解决小程序视图模糊的问题
      });
      chart.showLoading();
      canvas.setChart(chart);
      setChartData(chart, XzhouData,ylineData);

      return chart;
      function setChartData(chart, XzhouData,ylineData) {
        const option = {
          title: {
            text: '领取数量',
            left: 'left',
            show:false
          },
          color: ["#37A2DA"],
          //定义线的类型种类
          legend: {
            data: ['A'],
            top: 20,
            left: 'center',
            backgroundColor: 'red',
            z: 100,
            show:false
          },
          grid: {
            top:40,
            bottom:20,
            left:4,
            right:22,
            containLabel: true
          },
          //	x轴
          xAxis: {
            type: 'category',
            boundaryGap: false,
            splitNumber:XzhouData.length!=30?4:6,
            data: XzhouData,//x轴数据
            // x轴样式
            axisLabel: {
              show: true,
              textStyle: {
                color: '#ccc',
                fontSize: '14',
              }
            },
            splitLine: {
              show: false,
              lineStyle: {
                color: ['#ccc']
              }
            },
            axisLine: {
              lineStyle: {
                color: '#ccc',
                width: 1,
              },
              show:false
            }
          },
          yAxis: {
            x: 'center',
            type: 'value',
            minInterval:1,
            splitLine: {
              lineStyle: {
                type: 'dashed'
              }
            },
            axisLabel: {
              show: true,
              textStyle: {
                color: '#ccc',
                fontSize: '14',
              }
            },
            axisLine: {
              lineStyle: {
                color: '#ccc',
                width: 1,
              },
              show:false
            }
            // show: false
          },
          series: [{
            name: 'A',
            type: 'line',
            smooth: true,
            center: ['100%', '100%'],
            itemStyle: {
              normal: {
                color: '#DF3834',
                fontSize: '80',
                lineStyle: {
                  color: '#DF3834'
                },
                areaStyle: {
                  color: 'rgb(255,255,255)'
                },
              }
            },
            data: ylineData
          }]
        };
        chart.setOption(option)
        chart.hideLoading();
      }
    });
  }
4.页面中调用并使用组件
import Linechart from "../commoncomponents/linechart";
//组件使用,页面中哪里用到就放在哪里
<Linechart ref={this.refLineChart} />
//script中对ref实例进行注册
refLineChart = (node) => (this.lineChart = node)
5.调用数据的接口完成之后,为了防止数据未被渲染,可以加个setTimeout函数手动延迟
setTimeout(()=>{
	//调用组件里面的方法
	that.lineChart.refresh(XzhouData,listback2);

},20)
6.实现的效果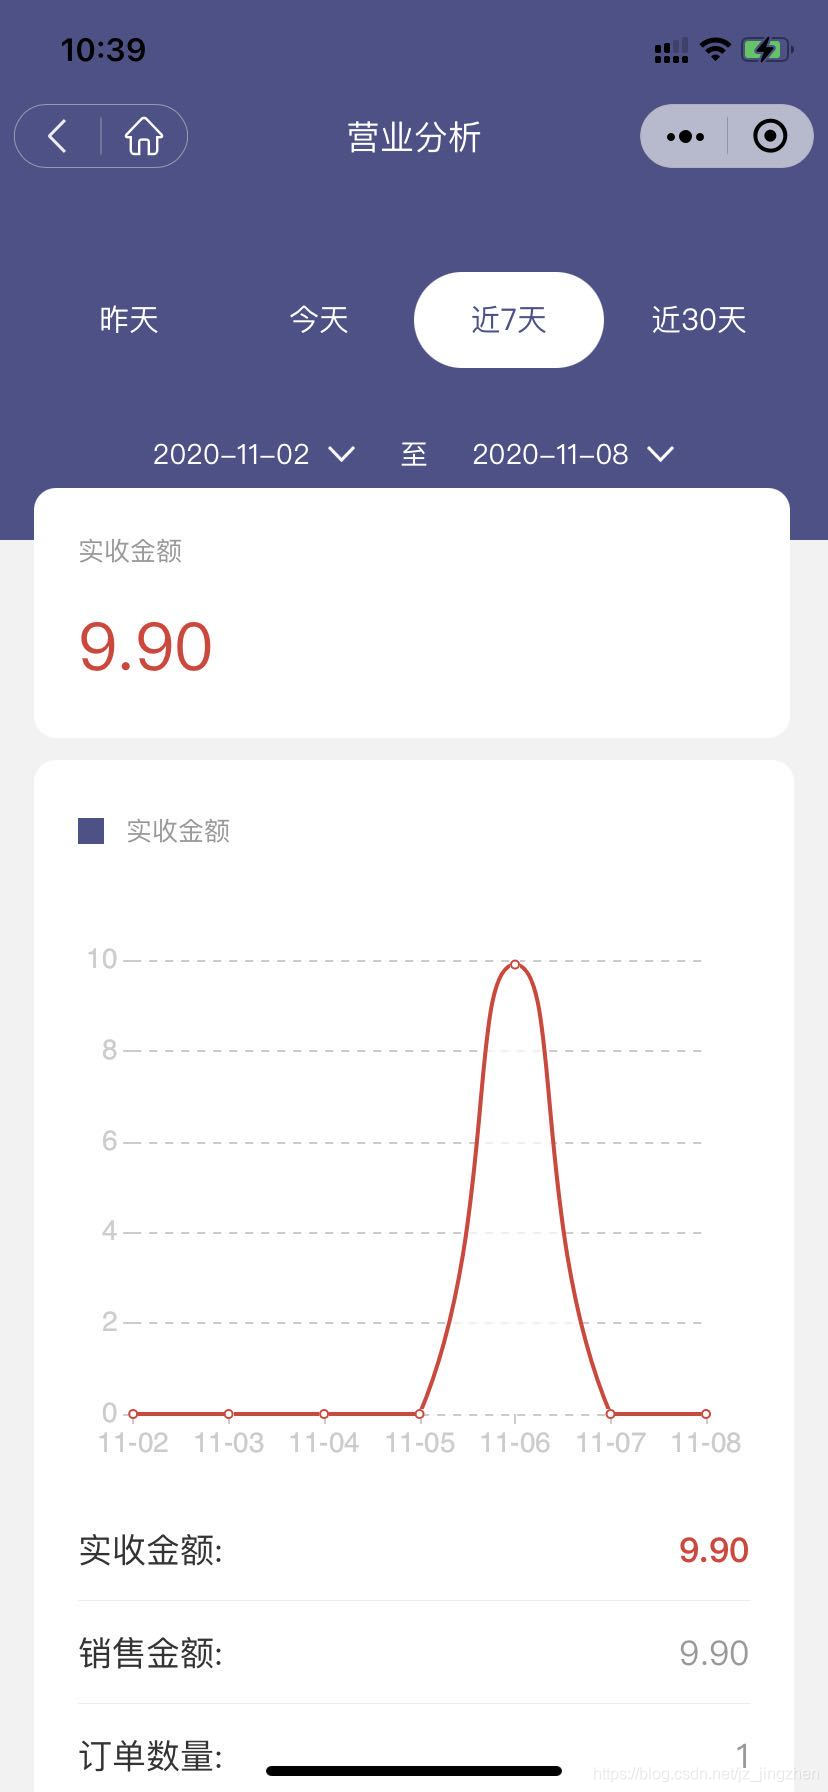
「注:本文只是个人根据taro使用等相关文档写出的一个确实可行的功能实现,若有不足或者更好的实现方法,望各位前辈不吝赐教。」


 2058
2058


 被折叠的 条评论
为什么被折叠?
被折叠的 条评论
为什么被折叠?
 到【灌水乐园】发言


