


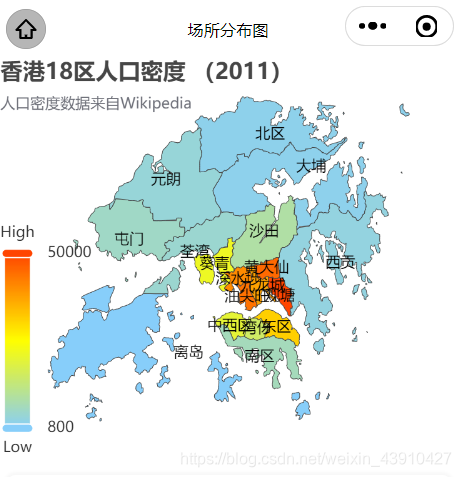
先放效果图:
以下是自己在摸索过程中的总结,有错误的地方欢迎指正:
一、tarojs 版本更新到3.0 以上
网上的处理版本目前以2.0 居多,试过很多次,无论怎么调试最终都会报奇奇怪怪的错误
二、安装echarts 依赖 echarts-taro3-react
三、开始上代码
地图组件部分(index.jsx):
import Taro from "@tarojs/taro";
import React, { Component } from "react";
import {
View,
Text,
Swiper,
SwiperItem,
Image,
Input,
Picker
} from "@tarojs/components";
// ui
import { AtForm, AtInput, AtButton, AtIcon, AtImagePicker } from "taro-ui";
import {fnfet, fnGet} from "../../../utils/http"
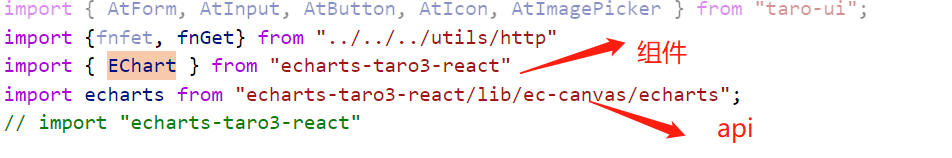
import { EChart } from "echarts-taro3-react"
import echarts from "echarts-taro3-react/lib/ec-canvas/echarts";
import "echarts-taro3-react"
import "./index.scss";
class Pie extends Component {
static defaultProps={
data: []
}
componentDidMount() {
console.log("哈哈哈")
this.getData()
}
getData(){
fnGet("https://echarts.apache.org/examples/data/asset/geo/HK.json",{},(res)=>{
console.log(res.data)
console.log(echarts,'echarts')
echarts.registerMap('HK', res.data);
this.refresh()
},false,true)
}
refresh() {
const { data } = this.props
const option = {
title: {
text: '香港18区人口密度 (2011)',
subtext: '人口密度数据来自Wikipedia',
sublink: 'http://zh.wikipedia.org/wiki/%E9%A6%99%E6%B8%AF%E8%A1%8C%E6%94%BF%E5%8D%80%E5%8A%83#cite_note-12'
},
tooltip: {
trigger: 'item',
formatter: '{b}<br/>{c} (p / km2)'
},
visualMap: {
min: 800,
max: 50000,
text: ['High', 'Low'],
realtime: false,
calculable: true,
inRange: {
color: ['lightskyblue', 'yellow', 'orangered']
}
},
series: [
{
name: '香港18区人口密度',
type: 'map',
roam:true,// 开启缩放以及平移
mapType: 'HK', // 自定义扩展图表类型
label: {
show: true
},
data: [
{name: '中西区', value: 20057.34},
{name: '湾仔', value: 15477.48},
{name: '东区', value: 31686.1},
{name: '南区', value: 6992.6},
{name: '油尖旺', value: 44045.49},
{name: '深水埗', value: 40689.64},
{name: '九龙城', value: 37659.78},
{name: '黄大仙', value: 45180.97},
{name: '观塘', value: 55204.26},
{name: '葵青', value: 21900.9},
{name: '荃湾', value: 4918.26},
{name: '屯门', value: 5881.84},
{name: '元朗', value: 4178.01},
{name: '北区', value: 2227.92},
{name: '大埔', value: 2180.98},
{name: '沙田', value: 9172.94},
{name: '西贡', value: 3368},
{name: '离岛', value: 806.98}
],
// 自定义名称映射
nameMap: {
'Central and Western': '中西区',
'Eastern': '东区',
'Islands': '离岛',
'Kowloon City': '九龙城',
'Kwai Tsing': '葵青',
'Kwun Tong': '观塘',
'North': '北区',
'Sai Kung': '西贡',
'Sha Tin': '沙田',
'Sham Shui Po': '深水埗',
'Southern': '南区',
'Tai Po': '大埔',
'Tsuen Wan': '荃湾',
'Tuen Mun': '屯门',
'Wan Chai': '湾仔',
'Wong Tai Sin': '黄大仙',
'Yau Tsim Mong': '油尖旺',
'Yuen Long': '元朗'
}
}
]
}
this.pieChart.refresh(option)
let _this = this;
this.pieChart.Chart.touchStart(res=>{
console.log(res,'返回值')
})
}
refPieChart = (node) => {
this.pieChart = node;
console.log(this.pieChart,'this.pieChart')
};
render() {
return (
<View className='pie-chart'>
<EChart ref={this.refPieChart} canvasId='pie-chart' />
</View>
)
}
}
export default Pie;
css部分:(index.scss)
.pie-chart{
    width: 100%;
    height: 650rpx;
    box-sizing: border-box;
}
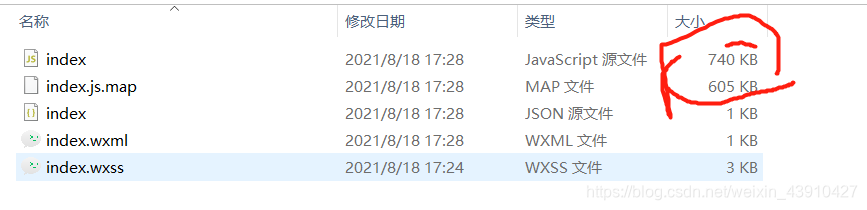
node_modules 中:

这个文件换成自己定制的

我这边目前还有点问题就是,这个超过 500kb的问题:
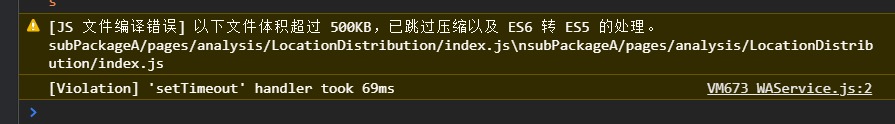
真机调试就会出不来,最近在做别的,所以没有继续去优化这里了,不过总算是能把图整出来了

未完待续(也不知道啥时候续,啥时候遇到啥时候续上!)


 2822
2822

 被折叠的 条评论
为什么被折叠?
被折叠的 条评论
为什么被折叠?
 到【灌水乐园】发言


