


一、创建vue3项目
使用 npm init vite@latest来创建项目
npm init vite@latest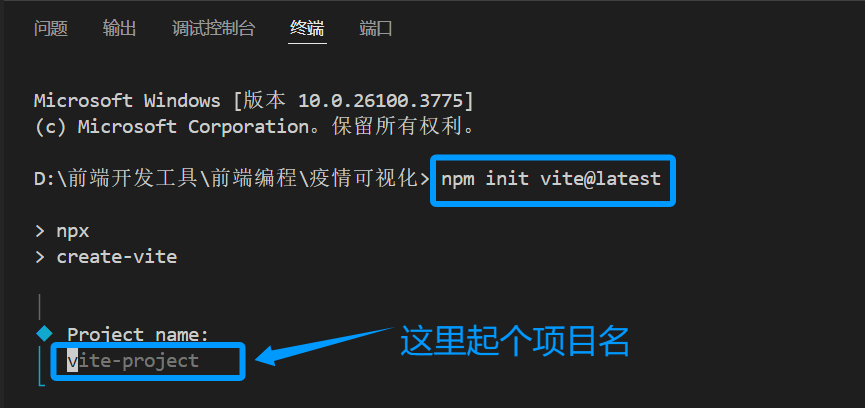
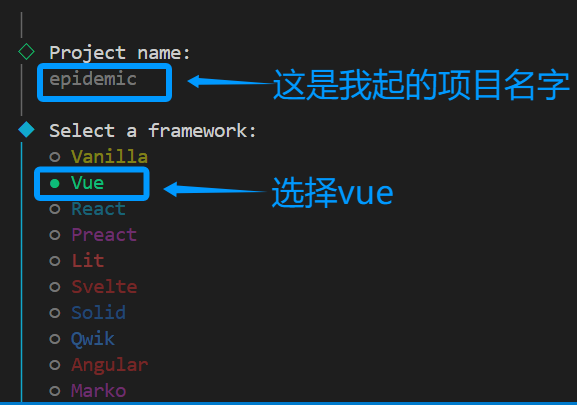
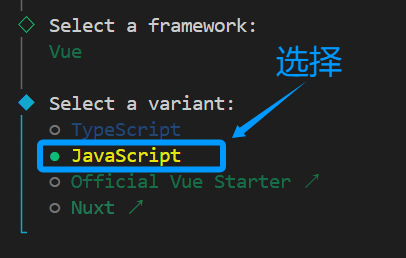
根据给出提示依次输入
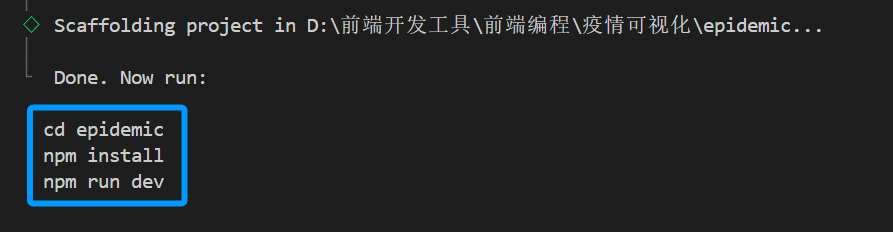
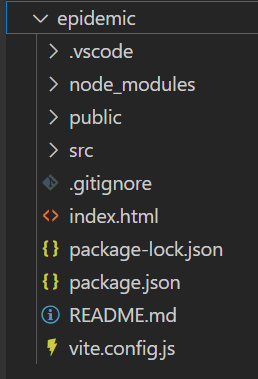
可得到以下内容

二、创建所需文件夹及文件+模块引入
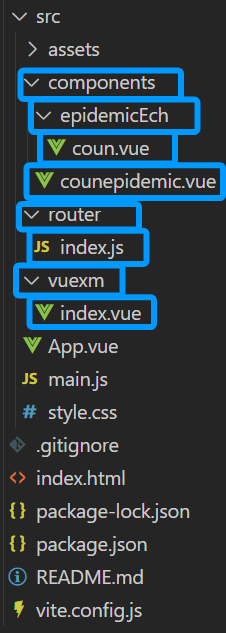
(一)、创建所需文件夹及文件
文件夹下有多余的文件一定要删除
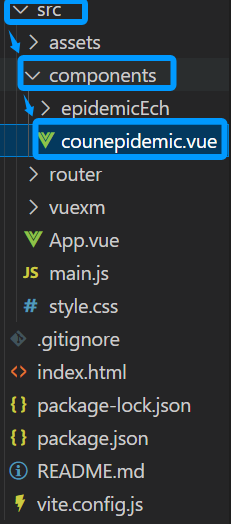
1.打开“src”文件夹,在里面打开"components"文件夹,然后在该文件夹下创建"counepidemic.vue"文件 + "epidemicEch"文件夹,
2.在"epidemicEch"文件夹下创建“coun.vue”文件
3.在src文件夹下创建“router”文件夹,在该文件夹下创建“index.js”文件
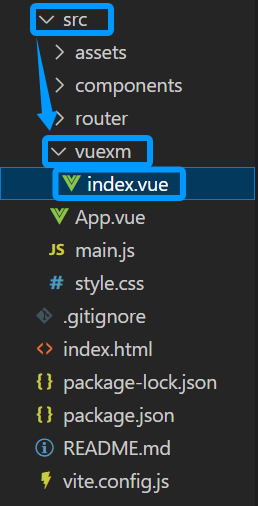
4.在src文件夹下创建“vuexm”文件夹,在该文件夹下创建“index.vue”文件
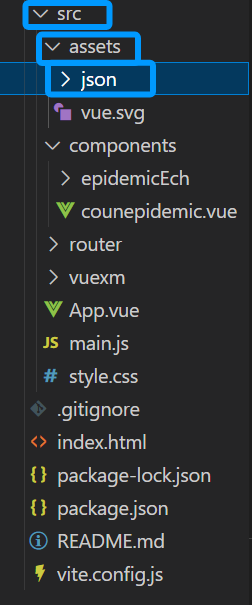
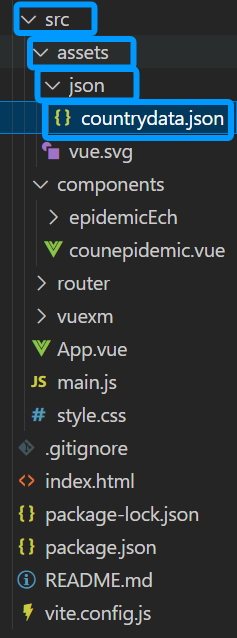
5.在src文件夹下的assets文件夹下创建“json”文件夹
(二)、模块引入
分别输入以下两个命令下载“路由配置”模块和“Echarts图表”模块
路由配置:
npm install vue-routerEcharts图表
npm install echarts三、路由配置
1、打开src文件夹下的“router”文件夹,
2、打开该文件夹下的“index.js”文件
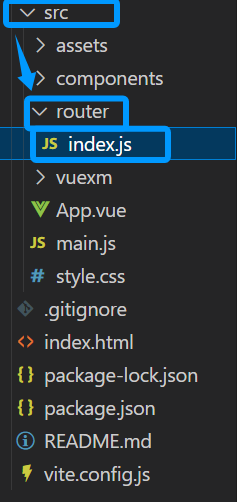
index.js文件,代码如下
import {createRouter,createWebHashHistory} from 'vue-router'
const routes=[
    {
        path:'/index',
        name:'index',
        component:()=>import('../vuexm/index.vue')
    },
    {
        path:'/',
        redirect:'/index'
    }
]
const router=createRouter({
    history:createWebHashHistory(),
    routes
})
export default router
3、打开src文件夹下的“vuexm”文件夹,
4、打开该文件夹下的“index.vue”文件
index.vue文件,代码如下
<script setup>
import { ref,reactive } from "vue";
import counepidemic from '../components/counepidemic.vue'
</script>
<template>
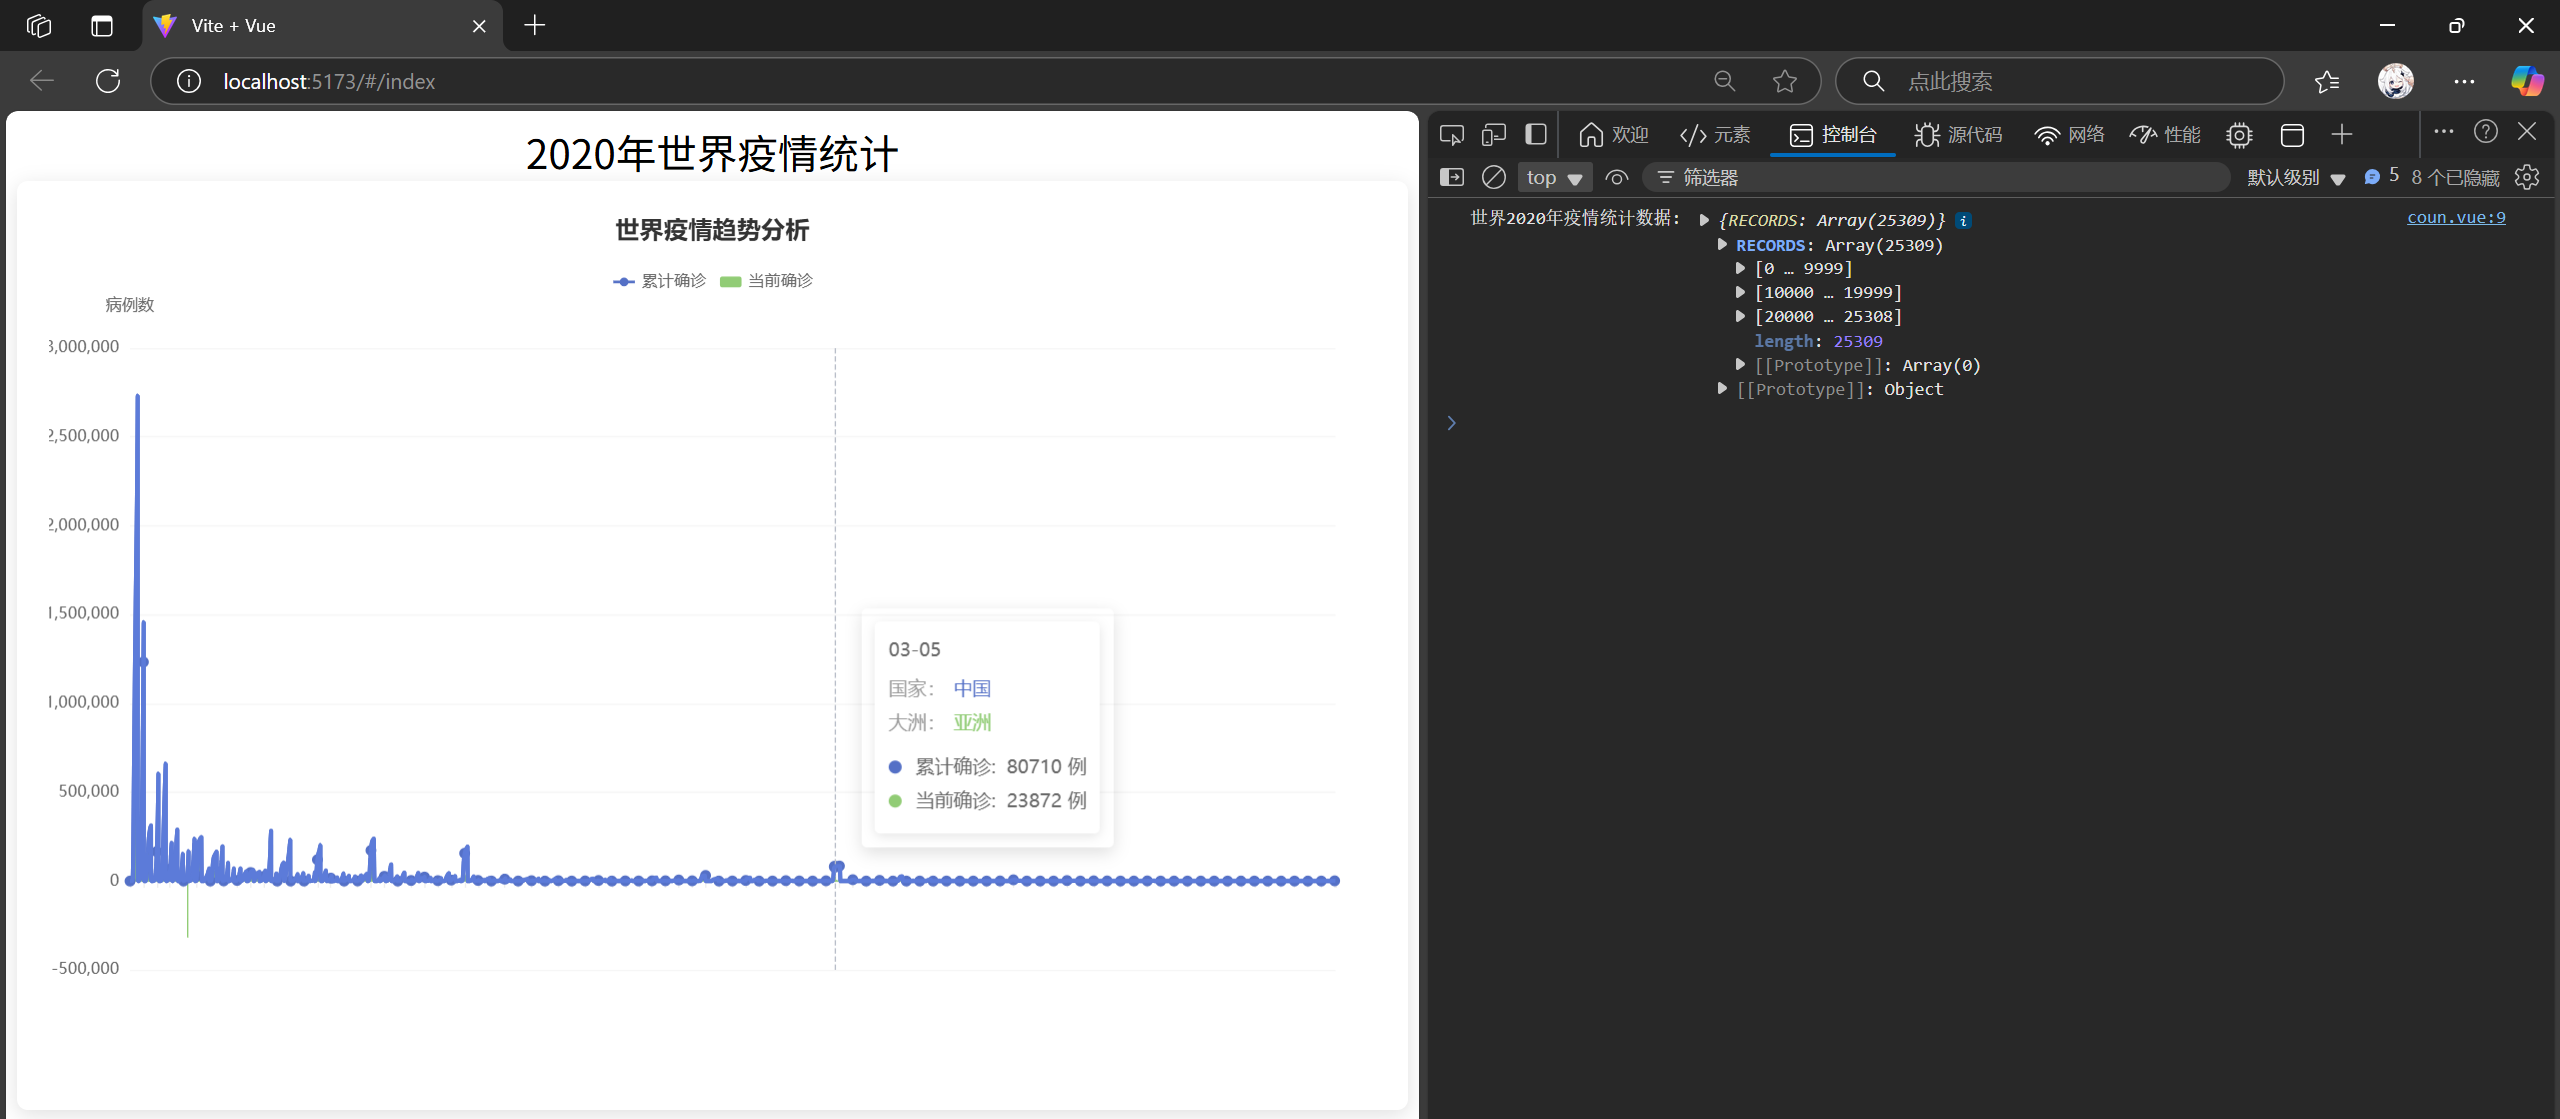
<div style="text-align: center; font-size: 30px;">2020年世界疫情统计</div>
<div>
<counepidemic />
</div>
</template>
<style scoped>
</style>
5、打开如图所示的“main.js”文件
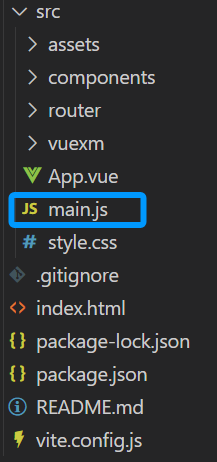
main.js文件,代码如下
import { createApp } from 'vue'
// import './style.css'
import App from './App.vue'
import router from './router/index.js'

createApp(App).use(router).mount('#app')
6.打开“src”文件夹,在里面打开"components"文件夹,然后在该文件夹下打开"counepidemic.vue"文件
counepidemic.vue文件,代码如下
<script setup>
import { ref,reactive } from "vue";
import count from './epidemicEch/coun.vue'
</script>

<template>
        <count />
</template>

<style scoped>

</style>
这里为了省去手动进入网页,如图进入“vite.config.js”文件,然后进行编译
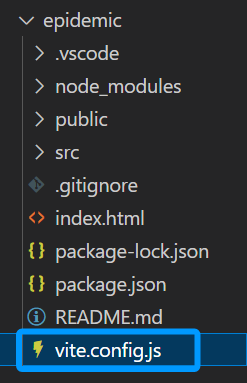
“vite.config.js”文件,代码如下
import { defineConfig } from 'vite'
import vue from '@vitejs/plugin-vue'

// https://vite.dev/config/
export default defineConfig({
  server:{
    open:true
  },
  plugins: [vue()],
})
四、获取json数据
提取码:KITE
把json数据文件放入“src”文件夹下的“assets”文件夹下的“json”文件夹里
五、开始编写可视化
1、打开“src”文件夹下的“components”文件夹
2、打开“components”文件夹下的“epidemicEch”文件夹
3、打开“epidemicEch”文件夹下的“coun.vue”文件
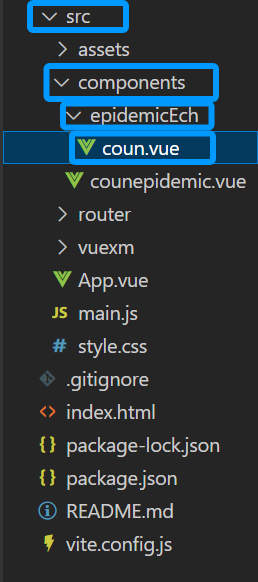
“coun.vue”文件,代码如下
<script setup>
// 引入Vue响应式函数和生命周期钩子
import { ref, onMounted, onBeforeUnmount } from "vue";
// 引入ECharts库和疫情数据集
import * as echarts from 'echarts';
import vcount from '../../assets/json/countrydata.json';

// 控制台输出原始数据结构
console.log("世界2020年疫情统计数据:",vcount);

// 图表DOM引用和ECharts实例
const chartRef = ref(null);
let myChart = null;


//  数据处理函数:将原始JSON数据转换为图表需要的格式
//  @returns {Object} 包含日期、累计确诊、当前确诊数据的对象

const processData = () => {
  return vcount.RECORDS.reduce((acc, curr) => {
    // 日期格式转换:将数字日期转换为YYYY-MM-DD格式
    const dateStr = curr.dateId.toString();
    const formattedDate = `${dateStr.slice(0,4)}-${dateStr.slice(4,6)}-${dateStr.slice(6,8)}`;

    // 存储结构化数据,保留原始数据维度
    acc.dates.push({
      date: formattedDate,        // 完整日期
      country: curr.countryName,  // 国家名称
      continent: curr.continent   // 所属大洲
    });

    // 累计确诊数据(带元数据)
    acc.confirmed.push({
      value: parseInt(curr.confirmedCount),
      country: curr.countryName,
      continent: curr.continent
    });

    // 当前确诊数据(带元数据)
    acc.current.push({
      value: parseInt(curr.currentConfirmedCount),
      country: curr.countryName,
      continent: curr.continent
    });

    return acc;
  }, { dates: [], confirmed: [], current: [] }); // 初始值包含三个数据集合
};


// 自定义Tooltip格式化函数
// @param {Array} params - ECharts提示框参数数组
// @returns {string} HTML格式的提示框内容

const tooltipFormatter = (params) => {
  const dataPoint = params[0];
  return `
    <div style="padding: 10px; background: #fff; border-radius: 4px; box-shadow: 0 2px 8px rgba(0,0,0,0.1)">
      <div style="font-size: 14px; color: #666; margin-bottom: 8px">
        ${dataPoint.axisValueLabel} <!-- 显示x轴值(月-日) -->
      </div>
      <div style="display: flex; align-items: center; margin-bottom: 4px">
        <span style="display: inline-block; width: 48px; color: #999">国家:</span>
        <span style="color: #5470c6; font-weight: 500">${dataPoint.data.country}</span>
      </div>
      <div style="display: flex; align-items: center; margin-bottom: 12px">
        <span style="display: inline-block; width: 48px; color: #999">大洲:</span>
        <span style="color: #91cc75; font-weight: 500">${dataPoint.data.continent}</span>
      </div>
      ${params.map(item => `
        <div style="display: flex; align-items: center; margin: 4px 0">
          ${item.marker} <!-- ECharts颜色标记 -->
          <span style="margin-left: 6px; color: #666">${item.seriesName}:</span>
          <span style="margin-left: 8px; font-weight: 500">${item.data.value} 例</span>
        </div>
      `).join('')}
    </div>
  `;
};


//  初始化ECharts图表配置

const initChart = () => {
  if (!chartRef.value) return;

  // 获取处理后的结构化数据
  const { dates, confirmed, current } = processData();

  // ECharts配置项
  const option = {
    title: {
      text: '世界疫情趋势分析',
      left: 'center',
      textStyle: {
        fontSize: 18,
        color: '#333'
      }
    },
    tooltip: {
      trigger: 'axis',          // 触发类型为坐标轴触发
      formatter: tooltipFormatter, // 使用自定义提示框
      backgroundColor: 'transparent',
      borderWidth: 0,
      extraCssText: 'box-shadow: 0 4px 12px rgba(0,0,0,0.12);' // 自定义阴影效果
    },
    legend: {
      data: ['累计确诊', '当前确诊'], // 图例项
      top: 40,                      // 距离顶部距离
      itemWidth: 16,                // 图例标记宽度
      itemHeight: 8,                // 图例标记高度
      textStyle: {
        color: '#666'
      }
    },
    xAxis: {
      type: 'category',
      data: dates.map(d => ({
        value: d.date.split('-').slice(1).join('-'), // 显示月-日格式
        country: d.country,
        continent: d.continent
      })),
      axisLabel: {
        rotate: 45,                 // 标签旋转角度
        formatter: (params) => params.value,
        margin: 15,                 // 标签与轴线间距
        color: '#666'
      },
      axisLine: {
        lineStyle: {
          color: '#eee'             // 轴线颜色
        }
      }
    },
    yAxis: {
      type: 'value',
      name: '病例数',              // 坐标轴名称
      nameTextStyle: {
        color: '#666',
        padding: [0, 0, 10, 0]     // 名称位置偏移
      },
      axisLabel: {
        color: '#666'
      },
      splitLine: {
        lineStyle: {
          color: '#f5f5f5'         // 分割线颜色
        }
      }
    },
    series: [
      { // 累计确诊折线图配置
        name: '累计确诊',
        type: 'line',
        data: confirmed,
        smooth: true,              // 平滑曲线
        symbol: 'circle',          // 数据点形状
        symbolSize: 8,
        lineStyle: {
          color: '#5470c6',        // 线条颜色
          width: 3
        },
        areaStyle: {               // 区域填充样式
          color: new echarts.graphic.LinearGradient(0, 0, 0, 1, [
            { offset: 0, color: '#5470c620' }, // 渐变起始颜色
            { offset: 1, color: '#5470c605' }  // 渐变结束颜色
          ])
        },
        emphasis: {                // 高亮样式
          focus: 'series',
          itemStyle: {
            color: '#5470c6',
            borderWidth: 2
          }
        }
      },
      { // 当前确诊柱状图配置
        name: '当前确诊',
        type: 'bar',
        data: current,
        itemStyle: {
          color: '#91cc75',        // 柱条颜色
          borderRadius: [2, 2, 0, 0] // 顶部圆角
        },
        barWidth: '40%',           // 柱条宽度
        emphasis: {
          itemStyle: {
            color: '#82c061'       // 高亮颜色
          }
        }
      }
    ],
    dataZoom: [{                  // 内置型数据区域缩放
      type: 'inside',
      start: 0,
      end: 100,
      zoomLock: true              // 锁定选择区域不可拉伸
    }],
    grid: {                       // 图表布局配置
      top: 100,                   // 距离顶部距离
      bottom: 80,                // 留出x轴标签空间
      left: 60,                  // y轴标签空间
      right: 30
    }
  };

  // 初始化ECharts实例并设置配置
  myChart = echarts.init(chartRef.value);
  myChart.setOption(option);
};

// 生命周期管理
onMounted(() => {
  initChart();
  // 添加窗口resize监听,自适应图表大小
  window.addEventListener('resize', () => myChart?.resize());
});

onBeforeUnmount(() => {
  // 组件卸载前移除监听并销毁实例
  window.removeEventListener('resize', () => myChart?.resize());
  myChart?.dispose();
});
</script>

<template>
  <!-- 图表容器 -->
  <div class="chart-container">
    <!-- ECharts DOM元素,通过ref绑定 -->
    <div ref="chartRef" style="width: 100%; height: 640px;"></div>
  </div>
</template>

<style scoped>
/* 容器样式 */
.chart-container {
  padding: 24px;                 /* 内边距 */
  background: white;             /* 背景色 */
  border-radius: 8px;            /* 圆角半径 */
  box-shadow: 0 2px 12px rgba(0, 0, 0, 0.08); /* 阴影效果 */
  transition: box-shadow 0.3s;  /* 过渡动画 */

  /* 悬停效果 */
  &:hover {
    box-shadow: 0 4px 16px rgba(0, 0, 0, 0.12);
  }
}
</style>
最后,如图打开App.vue文件
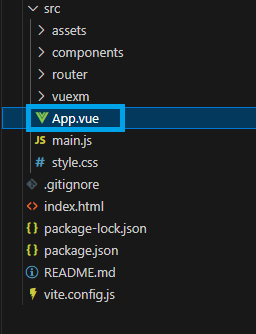
App.vue文件,代码如下
<script setup>
import {ref,reactive} from 'vue'
</script>

<template>
<router-view />
</template>

<style scoped>

</style>
六、验证结果
输入"npm run dev"命令验证结果
npm run dev结果如下


 被折叠的 条评论
为什么被折叠?
被折叠的 条评论
为什么被折叠?
 到【灌水乐园】发言


