


前两篇分别讲了 如何利用geoserver 发布矢量切片和openlayers 加载。接下来我们说 如何用leaflet 展示,既然做我们就作全面吧,谁让我们gis 就是这么苦逼呢,哈哈。
环境:
geoserver 2.21
vue 2.0
openlayers 6.14
leaflet 1.8
第一篇地址:geoserver发布矢量切片流程
geoserver 发布 矢量切片(pbf)并用openlayers 6.14 /leaflet 1.8 加载展示 (一)(小白必备:超详细教程)
第二篇地址:openlayers 加载矢量切片
geoserver 发布 矢量切片(pbf)并用openlayers 6.14 /leaflet 1.8 加载展示 (二)(小白必备:超详细教程)
开整:
简单说下就直接放源码了。
首先还是引入依赖,leaflet 的引入我还是提一下吧。
npm install leaflet --save
这里还需要引入一个它的插件:
npm i leaflet.vectorgrid
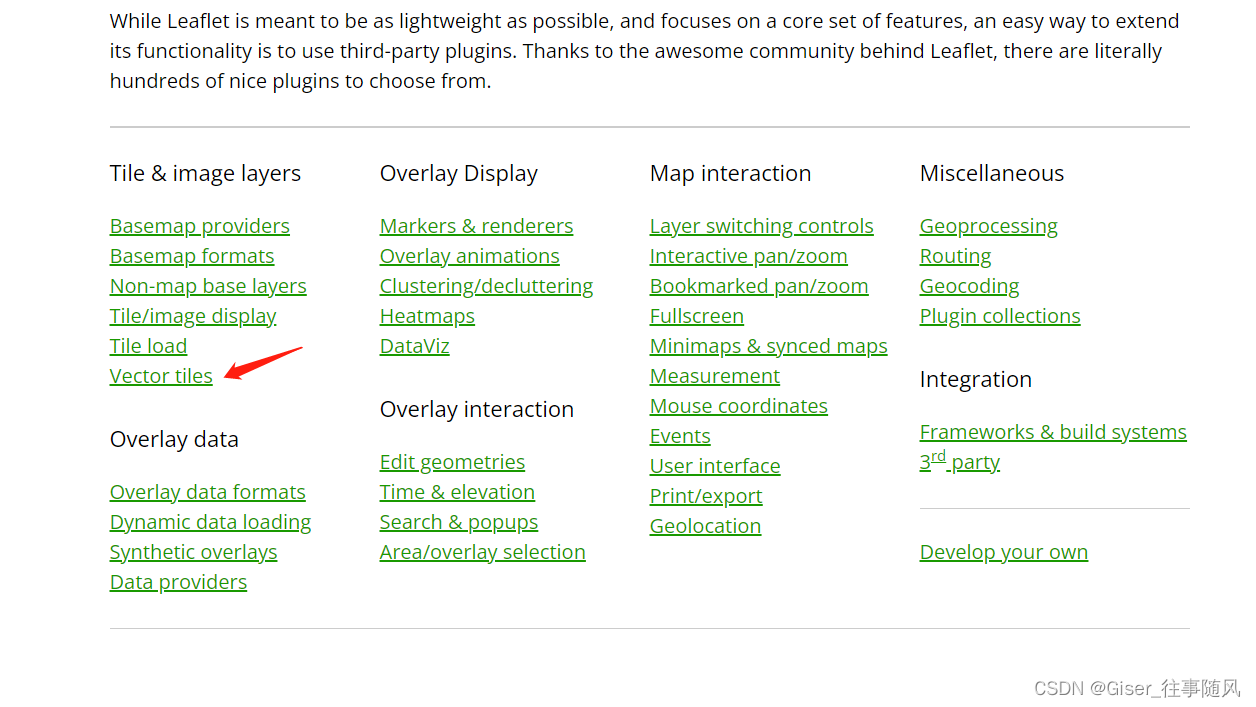
如果你不是vue的那就去官网下载插件
Plugins - Leaflet - a JavaScript library for interactive maps
 用这个!
用这个!
开闸!放源码!!
<template>
  <div id="leMap">
  </div>
</template>
<!--<script src="https://unpkg.com/leaflet.vectorgrid@latest/dist/Leaflet.VectorGrid.bundled.js"></script>-->
<!--<script src="https://unpkg.com/leaflet.vectorgrid@latest/dist/Leaflet.VectorGrid.js"></script>-->
<script>
import L from 'leaflet'
import  'leaflet.vectorgrid'

export default {
  name: "leMap",
  data() {
    return {
      leafletMapObj: null,
      tdt_token: 'e6372a5333c4bac9b9ef6097453c3cd6',
    }
  },
  mounted() {
    this.initLMap();
  },
  methods: {
    initLMap() {
      this.leafletMapObj = new L.Map('leMap', {
        center: [31.86, 117.28],
        zoom: 6,
        crs: L.CRS.EPSG4326
      })
      // 天地图影像底图url
      const imageURL = "http://t0.tianditu.gov.cn/img_c/wmts?" +
        "SERVICE=WMTS&REQUEST=GetTile&VERSION=1.0.0&LAYER=img&STYLE=default&TILEMATRIXSET=c&FORMAT=tiles" +
        "&TILEMATRIX={z}&TILEROW={y}&TILECOL={x}&tk=" + this.tdt_token;
      var tiandituyinxian = L.tileLayer(imageURL, {
        attribution: "stamen",
        maxZoom: 20,
        tileSize: 256,
        zoomOffset: 1,
      });
      tiandituyinxian.addTo(this.leafletMapObj);


      this.leafletMapObj.on('click', (evt) => {
        console.log(evt)
      })
      // const vectorTileLayerTemp=  L.vectorGrid.protobuf('http://localhost:7777/geoserver/gwc/service/tms/1.0.0/testKH%3Aanhuis@EPSG%3A4326@pbf',{});
      // this.leafletMapObj.addLayer(vectorTileLayerTemp)
      const pbfUrl = "http://localhost:7777/geoserver/gwc/service/tms/1.0.0/testKH%3Aanhuis@EPSG%3A4326@pbf/{z}/{x}/{y}.pbf";
      var vectorTileOptions = {
        layerURL: pbfUrl,
        rendererFactory: L.canvas.tile,
        tms: true,
        vectorTileLayerStyles: {
          'vegpl': function (properties, zoom) {
            return {
              fillColor: 'green',
            }
          },
        },
        interactive: true,	//开启VectorGrid触发mouse/pointer事件
        getFeatureId: function (f) {
          return f.properties.osm_id;
        }
      };
      var vectorTile = new L.vectorGrid.protobuf(pbfUrl, vectorTileOptions).addTo(this.leafletMapObj);
    },

  },
  components: {}
}
</script>

<style scoped>
#leMap {
  width: 100%;
  height: 100%;
}
</style>
哦对了,我这页面都没引入css 啊,哎还是放一下吧,不缺这一点。
//引入ol css
import "ol/ol.css";
其中需要注意的是,放入的url 是 pbf地址
http://localhost:7777/geoserver/gwc/service/tms/1.0.0/testXXX%3Ahefei_xiang@EPSG%3A4326@pbf
+
/{z}/{x}/{y}.pbf
好了,看下效果,搞定!


 4551
4551


 被折叠的 条评论
为什么被折叠?
被折叠的 条评论
为什么被折叠?
 到【灌水乐园】发言


