


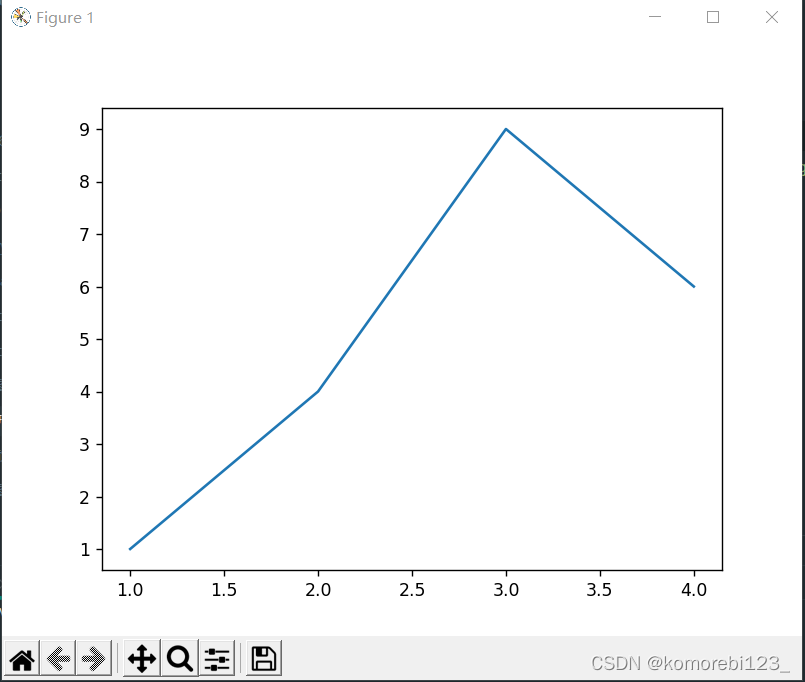
import matplotlib.pyplot as plt


x = [1, 2, 3, 4]
y = [1, 4, 9, 6]

plt.plot(x, y)

plt.show()
如图:
import matplotlib.pyplot as plt


x = [1, 2, 3, 4]
y = [1, 4, 9, 6]
labels = ['Frogs', 'Hogs', 'Bogs', 'Slogs']

plt.plot(x, y)

plt.xticks(x)
plt.show()
如图:
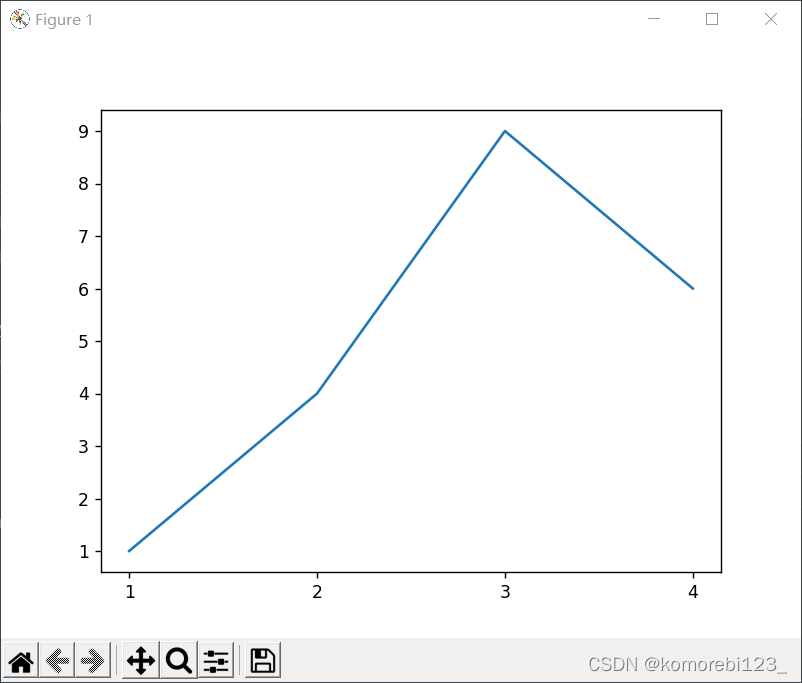
设置坐标值的刻度(传入一个参数)
import matplotlib.pyplot as plt


x = [1, 2, 3, 4]
y = [1, 4, 9, 6]
labels = ['Frogs', 'Hogs', 'Bogs', 'Slogs']

plt.plot(x, y)

plt.xticks(x, labels)
plt.show()
如图:
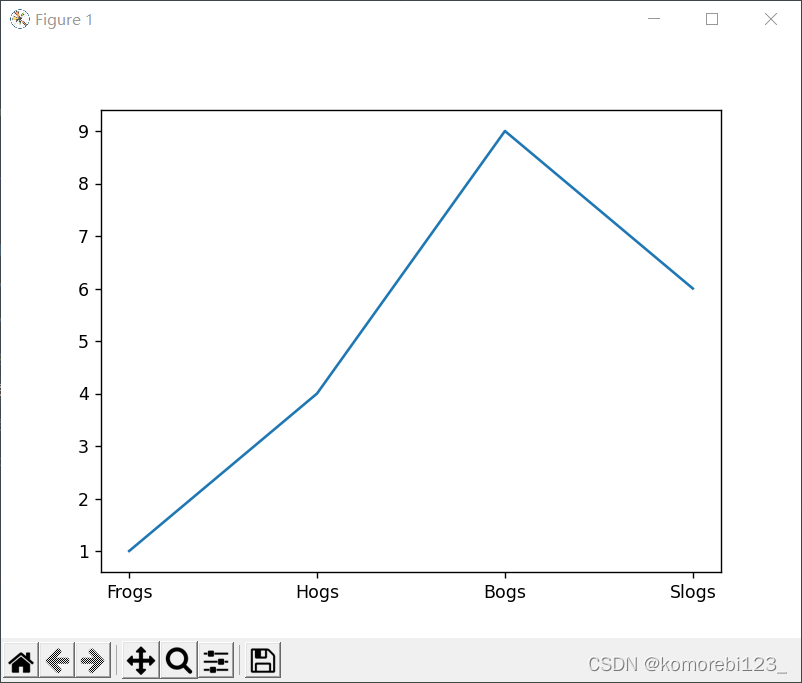
设置坐标轴刻度的标签(传入两个参数,一个是刻度ticks,另一个是标签lables)
plt.xticks( [] )
不显示坐标值


 7272
7272


 被折叠的 条评论
为什么被折叠?
被折叠的 条评论
为什么被折叠?
 到【灌水乐园】发言


