


Description
PGL is a library that encapsulates plot capabilities in a MFC project for VC6 and VC7. It is designed to be able to easily plot data generated in a project without the need of any external software. In fact, with CView and CDialog derived classes, you can have your app display chart in 5 minutes.
The aim of PGL is not to have a user-friendly environment but rather being able to generate any plot from the source code.
PGL was originally using OpenGL to raster graphics but now it uses GDI+ (so you need to install Microsoft SDK to compile PGL).
Licensing
The source available on CodeProject is licensed under LGPL. However, the next releases are not free anymore (Ooops, sorry). You can check the latest development at PGL Home Page. Anyway, enjoy beautiful charting.Features
- line strip, fully customisable:
- color (RGBA),
- line dashing,
- point type (circle, box, triangle, etc...)
- line width,
- filled,
- line shadow,
- multiple line strip,
- etc...
- line strip with level of detail capabilities (based on Douglas-Peukler line simplification algorithm),
- Vector map,
- Height map,
- Text,
- variable scale,
- multiple fonts,
- orientable,
- Unlimited sub-plotting,
- Automatic axis,
- Time labelling,
- Export to EPS, SVG, JPEG, TIFF, PNG,
- CView derived class for fast integration in existing project,
- CDialog derived class, etc...
UML
A UML diagram is available in pdf here. It is not complete but it should help you in understanding the library.Installation
Here are the installation steps to usePGL in one of your projects:
- Install
GDI+(part of Microsoft SDK). - Download Gdiplus.dll and make sure it is in the path,
- Recompile the source, it will build .lib in the lib directory and the .dll in the bin directory
- Add the directory with
PGLbinaries to your path. (by default it is C:/Program Files/PGL/bin) - Add the include directory and lib directory to Visual C++ include/lib directories.
- Make sure the headers are available
That's it!
Getting your project started
- Add the following in your StdAfx.h file :
#include "PGL.h"
- Since
PGLis usingGDI+, you must initialize it :- Add the following variable to your
CWinAppderived classULONG_PTR m_ulGdiplusToken;
- Add the following to the CWinApp::OnInitInstance function to initialize
GDI+// initialize <code>GDI+ (gdi+ is in Gdiplus namespace) Gdiplus::GdiplusStartupInput gdiplusStartupInput; Gdiplus::GdiplusStartup(&m_ulGdiplusToken, &gdiplusStartupInput, NULL);
- Add the following to the CWinApp::OnExitInstance function to clean up
GDI+.// shutdown GDI+ Gdiplus::GdiplusShutdown(m_ulGdiplusToken);
- Add the following variable to your
Examples
All these examples are accessible in the source. See the example menu of TestPGL.
Example 1 : Drawing a simple line
This is a first explanatory example. We suppose that the points (x,y) of the line have been generated and are stored in two arraypX,pY of size
nPoints ( note that you can also pass data as
std::vector<double> to
PGL).

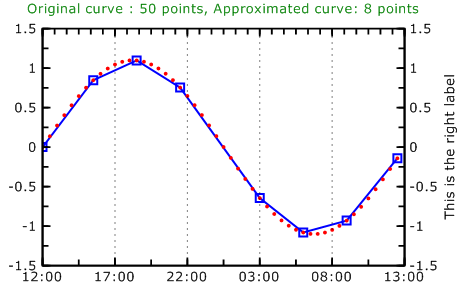
Here's the code I used to generate the data: a simple sinusoid. Note that the y are in [-1.1, 1.1] but PGL will handle axe labelling the have nice units.
// generate data
int nPoints = 50;
double* pX=new double[nPoints];
double* pY=new double[nPoints];
for (UINT i=0;i< nPoints;i++)
{
	pX[i]=i;
	pY[i]=sin(i/(double)nPoints*2*3.14)*1.1;
}
- First, create a graph object:
CPGLGraph* pGraph = new CPGLGraph;Note that you can check allPGLobject withASSERT_VALIDsince they all inherit fromCObject. - Create a 2D line:
CPGLLine2D* pLine = new CPGLLine2D; - Attach the data to the line.
PGLwill handle the memory afterwards. That is, it will delete the pointers of data at the object destruction. This meanspX,pYMUST have been allocated on the heap !pLine->SetDatas( nPoints /* number of points */, pX /* x(i) */, pY /* y(i) */);
- (Optional)Change some properties of the line: pLine->SetLineWidth(2);
- Add the line to the graph (note that an object can be added to only one graph):
pGraph->AddObject(pLine); - Make
PGLscale the plot (automatically)pGraph->ZoomAll(); - Create a dialog box and display the plot:
CPGLGraphBitDlg graphdlg(this, pGraph);
graphdlg.DoModal();
PGL.
Example 2 : Adding a line with level of detail control
You may have to plot line with thousands of points. This can become very heavy and especially if you export it to EPS, the files can become very large. To overcome this problem, you can use a line with LOD included inPGL.

- Change the line of code
CPGLLine2D* pLine = new CPGLLine2D;toCPGLLine2DLOD* pLine = new CPGLLine2DLOD; - Change tolerance of level of detail
pLine->SetTol(0.05);
- Shrink the number of points by a desired compression ratio (here to 10% with 2% threshold)
pLine->ShrinkNorm(0.1,0.02);
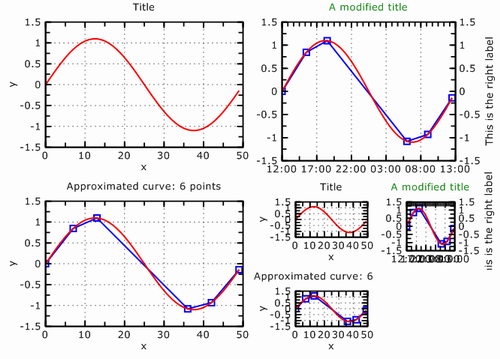
Example 3: Customizing axis, labeling, etc...
As you can see in the previous image, all the parameters of the objects are changeable in the code. In this example, we shall- change the title text,
- turn off horizontal grid,
- show right label,
- change number of ticks on the top axis,
- switch to time labelling for the x-axis,
- and more...
ZoomAll().
- Get a pointer the axis object (there a huge mistake of English but in French it's ok :)(axe -> axis))
CPGLAxe2D* pAxis = pGraph->GetAxe();
- Change the title text and color
pAxis->SetTitle(str);orpAxis->GetTitle()->SetString(str);
pAxis->GetTitle()->SetColor(0 /* red */,0.5f /* green */,
                            0 /* blue*/ /* alpha optional */);
- Turn off vertical grid, (vertical -> 0, horizontal -> 1)
pAxis->SetShowGrid(1,FALSE);
- Show and change right label,
pAxis->GetRightLabel()->Show(TRUE); pAxis->GetRightLabel()->SetString("This is the right label");
- Show right numbering
pAxis->GetRightNumber()->Show();
- Changing number of ticks on the top axis,
pAxis->SetTopSecondTicksNb(5);
- Switch to time labelling the x-axis,
// enable time labelling
pAxis->SetTimeLabel(TRUE);
// set origin, time step and format (see COleDateTime.Format for details)
pAxis->SetTimeLabelFormat(COleDateTime::GetCurrentTime()
                                /* Time at zero. */,
			COleDateTimeSpan(0,0,30,0) /* Time per unit */,
			"%H:%M:%S" /* String format */);
Example 4: Sub-plotting !
What about putting multiple plots on a figure: that's possible inPGL in many ways. In fact you can add plots to plots, and so on.
CPGLGraph is inherited from a generic plot class :
CPGLRegion. You can either
- use the function
Divide(m,n)to divide the region in an array of m rows and n columns (Note that this method erase all object in the region). After that, you can access the elements withGetChilds(i)(the regions are created row by row). You can get the number of children withGetNChilds():// allocated somewhere CPGLRegion* pRegion; // dividing pRegion->Divide(m,n); // accessing region at row 2 and column 1 (zero based index) CPGLRegion* pChildRegion = pRegion->GetChild(2*n+1);
- Create an add directly a region using
AddRegion. To use this method you mustSetNormBBox(...)to set the bounding box (in Normalized coordinates with respect to the parent region)CPGLRegion* pChildRegion = pRegion->AddRegion(); pChildRegion->SetNormBBox(0.1 /* llx */ , 0.2 /* lly */ , 0.7 /* urx */ , 0.8 /* ury */);
Example 5: Changing properties of objects at runtime
You can explore the object hierarchy by right clicking the view or dialog. Unfortunately, serialization is not working yet. So it is lost work...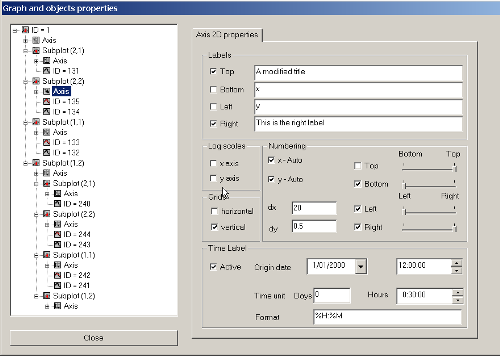
Reference
The documentation is generated with Doxygen and Doxygen studio. See Plot Graphic Library.dow file. Otherwize, it is shipped with the Microsoft Installer.Download
You can download the Microsoft installer at the PGL Home PageCompiling the sources
The sources of PGL are provided. Open the workspace
- "Plot Graphic Library.dsw" for VC6 users
- "Plot Graphic LibraryNET.dsw" for VC7 users
It contains 6 projects :
- AlgoTools. Collection of Algorithmic classes. This project contains the algorithm for line approximation.
- IGfx. Graphic library used by
PGL. Multi-layer graphic interface to export in multiple graphic format such as EPS or SVG. - IGfxTest. Test project for IGfx.
- OGLTools. A useful library to handle OpenGL with Windows. Not used anymore but useful anyway.
PGL. The graphic library.- Testpgl. An demo application.
History
- 6-11-2002 Added VC7 build, fixed some stuff and updated DPHull.
- 15 July 2002: Fixed ressource missing, change CP_THREAD_ACP to CP_ASP, fixed, export bug and text strip bug.
- 5 June 2002 Updated downloads
- 29 March 2002 Big Update !
- 8 November 2001 Initial release.


 1404
1404

 被折叠的 条评论
为什么被折叠?
被折叠的 条评论
为什么被折叠?
 到【灌水乐园】发言


