


click through rate prediction
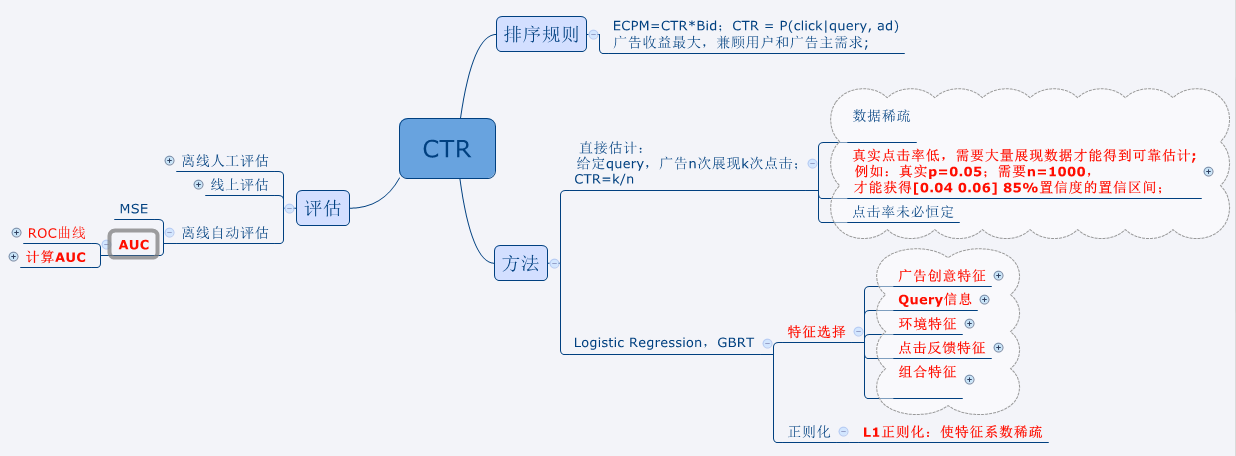
包括内容如下图:
使用直接估计法,置信区间置信率的估计:
1.使用二项分布直接估计
p(0.04<p^<0.06)=∑0.04n≤k≤0.06n(nk)0.05k0.95n−k p(0.04<p^<0.06)=∑0.04n≤k≤0.06n(nk)0.05k0.95n−k
|
1
2
3
4
5
6
|
low
=
ceil(n
*
0.04
);
%
上取整
high
=
floor(n
*
0.06
);
%
下取整
prob
=
0
;
for
i
=
low:
1
:high
prob
=
prob
+
nchoosek(n,i)
*
(
0.05
^i)
*
(
0.95
^(n
-
i));
end
|
2.使用正态分布近似
μ=p=0.05,σ2=p(1−p)n=0.05∗0.95n μ=p=0.05,σ2=p(1−p)n=0.05∗0.95n
|
1
|
normcdf(
0.06
,
0.05
,sigma
/
x(i)^
0.5
)
-
normcdf(
0.04
,
0.05
,sigma
/
x(i)^
0.5
)
|
|
1
2
3
4
5
6
7
8
9
10
11
12
13
14
15
16
17
|
warning off
all
;
clear
all
;clc;close
all
;
x
=
500
:
1
:
1500
;
y
=
zeros(
1
,size(x,
2
));
y2
=
zeros(
1
,size(x,
2
));
sigma
=
sqrt(
0.05
*
0.95
);
for
i
=
1
:size(x,
2
)
y(i)
=
adPredict(x(i));
y2(i)
=
normcdf(
0.06
,
0.05
,sigma
/
x(i)^
0.5
)
-
normcdf(
0.04
,
0.05
,sigma
/
x(i)^
0.5
);
end
plot(x,y,
'b-'
); hold on;
plot(x,y2,
'r-'
);
hold on;
x1
=
[
500
1500
];
y1
=
[
0.85
0.85
];
plot(x1,y1,
'y-'
);
|
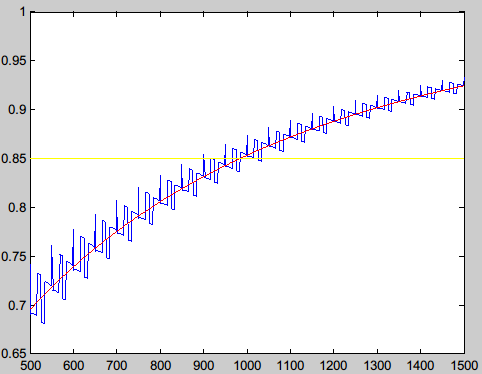
打印曲线:观测到,n=1000,差不多置信度会到达0.85
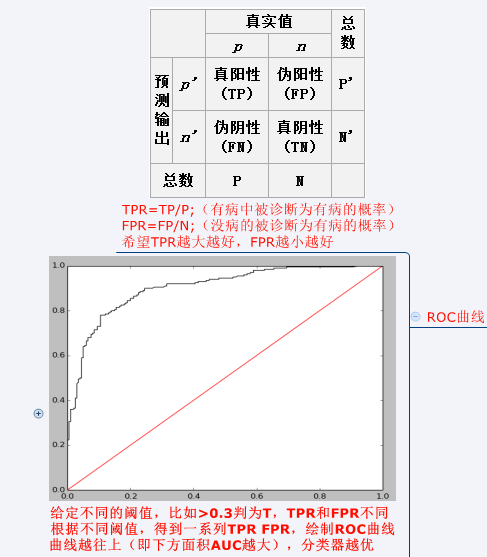
AUC概念及计算:
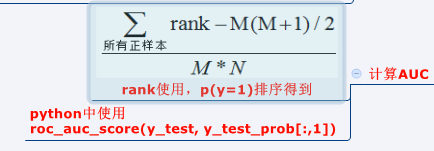
sklearn代码:sklearn中有现成方法,计算一组TPR,FPR,然后plot就可以;AUC也可以直接调用方法。

import numpy as np
import matplotlib.pyplot as plt

from sklearn.linear_model import LogisticRegression
from sklearn import datasets
from sklearn.preprocessing import StandardScaler
from sklearn.metrics import roc_auc_score
from sklearn.metrics import roc_curve

digits = datasets.load_digits()

X, y = digits.data, digits.target
X = StandardScaler().fit_transform(X)

# classify small against large digits
y = (y > 4).astype(np.int)
X_train = X[:-400]
y_train = y[:-400]

X_test = X[-400:]
y_test = y[-400:]

lrg = LogisticRegression(penalty='l1')
lrg.fit(X_train, y_train)

y_test_prob=lrg.predict_proba(X_test)
P = np.where(y_test==1)[0].shape[0];
N  = np.where(y_test==0)[0].shape[0];

dt = 10001
TPR = np.zeros((dt,1))
FPR = np.zeros((dt,1))
for i in range(dt):
    y_test_p = y_test_prob[:,1]>=i*(1.0/(dt-1))
    TP = np.where((y_test==1)&(y_test_p==True))[0].shape[0];
    FN = P-TP;
    FP = np.where((y_test==0)&(y_test_p==True))[0].shape[0];
    TN = N - FP;
    TPR[i]=TP*1.0/P
    FPR[i]=FP*1.0/N


plt.plot(FPR,TPR,color='black')
plt.plot(np.array([[0],[1]]),np.array([[0],[1]]),color='red')
plt.show()

#use sklearn method
# fpr, tpr, thresholds = roc_curve(y_test,y_test_prob[:,1],pos_label=1)
# plt.plot(fpr,tpr,color='black')
# plt.plot(np.array([[0],[1]]),np.array([[0],[1]]),color='red')
# plt.show()

rank = y_test_prob[:,1].argsort()
rank = rank.argsort()+1
auc = (sum(rank[np.where(y_test==1)[0]])-(P*1.0*(P+1)/2))/(P*N);
print auc
print roc_auc_score(y_test, y_test_prob[:,1])


 1359
1359


 被折叠的 条评论
为什么被折叠?
被折叠的 条评论
为什么被折叠?
 到【灌水乐园】发言


