


from wordcloud import WordCloud
import matplotlib.pyplot as plt
# 添加词语
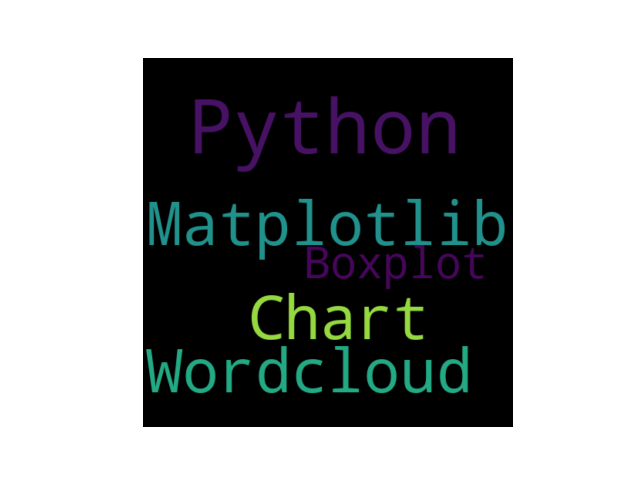
text = ("Python Matplotlib Chart Wordcloud Boxplot")
# 创建词云对象
wordcloud = WordCloud(width=480, height=480, margin=0).generate(text)
# 显示词云图
plt.imshow(wordcloud, interpolation='bilinear')
plt.axis("off")
plt.margins(x=0, y=0)
plt.show() # 词云图


 2501
2501


 被折叠的 条评论
为什么被折叠?
被折叠的 条评论
为什么被折叠?
 到【灌水乐园】发言


