1、index.html
<!DOCTYPE html>
<html lang="en">
<head>
<meta charset="UTF-8">
<meta http-equiv="X-UA-Compatible" content="IE=edge">
<meta name="viewport" content="width=device-width, initial-scale=1.0">
<title>Document</title>
<script src="https://cdn.jsdelivr.net/npm/leaflet@1.9.4/dist/leaflet.min.js"></script>
<link href="https://cdn.jsdelivr.net/npm/leaflet@1.9.4/dist/leaflet.min.css" rel="stylesheet">
<style>
* {
padding: 0;
margin: 0;
}
html,
body,
#map {
height: 100%;
width: 100%;
overflow: hidden;
}
</style>
</head>
<body>
<div id="map"></div>
<script type="module">
import {bboxToGrid, gridToBbox, getGridDatasOfView} from './util.js'
L.CRS.CustomEPSG4326 = L.extend({}, L.CRS.Earth, {
code: 'EPSG:4326',
projection: L.Projection.LonLat,
transformation: new L.Transformation(1 / 180, 1, -1 / 180, 0.5),
scale: function (zoom) {
return 256 * Math.pow(2, zoom - 1);
}
});
const token = '天地图的key';
let map = L.map('map', {
crs: L.CRS.CustomEPSG4326
}).setView([39.92, 116.39], 18);
let gridLayers = {};
L.tileLayer(
'https://t{s}.tianditu.gov.cn/img_c/wmts?SERVICE=WMTS&REQUEST=GetTile&VERSION=1.0.0&LAYER=img&STYLE=default&TILEMATRIXSET=c&FORMAT=tiles&TILECOL={x}&TILEROW={y}&TILEMATRIX={z}&tk=' +
token, {
attribution: false,
subdomains: [0, 1, 2],
}
).addTo(map);
map.on('load', init());
map.on('moveend', () => {
init();
});
function init(){
const zoom = map.getZoom();
const bounds = map.getBounds();
const southWest = bounds.getSouthWest();
const northEast = bounds.getNorthEast();
const [x1,y1,x2,y2] = [southWest.lng, southWest.lat, northEast.lng, northEast.lat];
const gridBound = bboxToGrid([x1, y1, x2, y2], zoom);
const gridDatas = getGridDatasOfView(gridBound, zoom);
drawGrids(gridDatas,zoom);
}
function drawGrids(gridDatas, zoom){
removeGridLayers();
gridDatas.forEach(gridData => {
const {x, y} = gridData;
const bbox = gridToBbox(x, y, zoom);
var bounds = [[bbox[1], bbox[0]], [bbox[3], bbox[2]]];
const layer = L.rectangle(bounds, {color: "#ff7800", weight: 1});
const gridName = `${x}_${y}_${zoom}`;
gridLayers[gridName] = layer;
map.addLayer(layer);
addGridNameText(layer.getCenter(), x, y, zoom);
});
}
function addGridNameText(latlon, x, y, zoom) {
const text = `${x}x${y}_${zoom}`;
const myIcon = L.divIcon({
html: text,
className: 'my-div-icon',
iconSize: 30
});
const gridNameText = `${text}_txt`;
const marker = L.marker(latlon, { icon: myIcon });
gridLayers[gridNameText] = marker;
map.addLayer(marker);
}
function removeGridLayers(){
Object.keys(gridLayers).forEach(key => {
map.removeLayer(gridLayers[key]);
});
gridLayers = {};
}
</script>
</body>
</html>
2、util.js
export function bboxToGrid(bbox, zoom) {
const x1 = Math.floor((bbox[0] + 180) / (360 / Math.pow(2, zoom)));
const y1 = Math.ceil((90 - bbox[1]) / (180 / Math.pow(2, zoom - 1)));
const x2 = Math.ceil((bbox[2] + 180) / (360 / Math.pow(2, zoom)));
const y2 = Math.floor((90 - bbox[3]) / (180 / Math.pow(2, zoom - 1)));
return [x1, y1, x2, y2];
}
export function getGridDatasOfView(grids) {
const gridDatas = [];
for (let i = grids[0]; i < grids[2]; i++) {
for (let j = grids[3]; j <= grids[1]; j++) {
const gridData = { x: i, y: j };
gridDatas.push(gridData);
}
}
return gridDatas;
}
export function gridToBbox(x,y,z) {
const x1 = x * 256 * (360 / (Math.pow(2, z) * 256)) - 180;
const y1 = 90 - y * 256 * (180 / (Math.pow(2, z - 1) * 256));
const x2 = x1 + 360 / Math.pow(2, z);
const y2 = y1 + 180 / Math.pow(2, z - 1);
return [x1, y1, x2, y2];
}
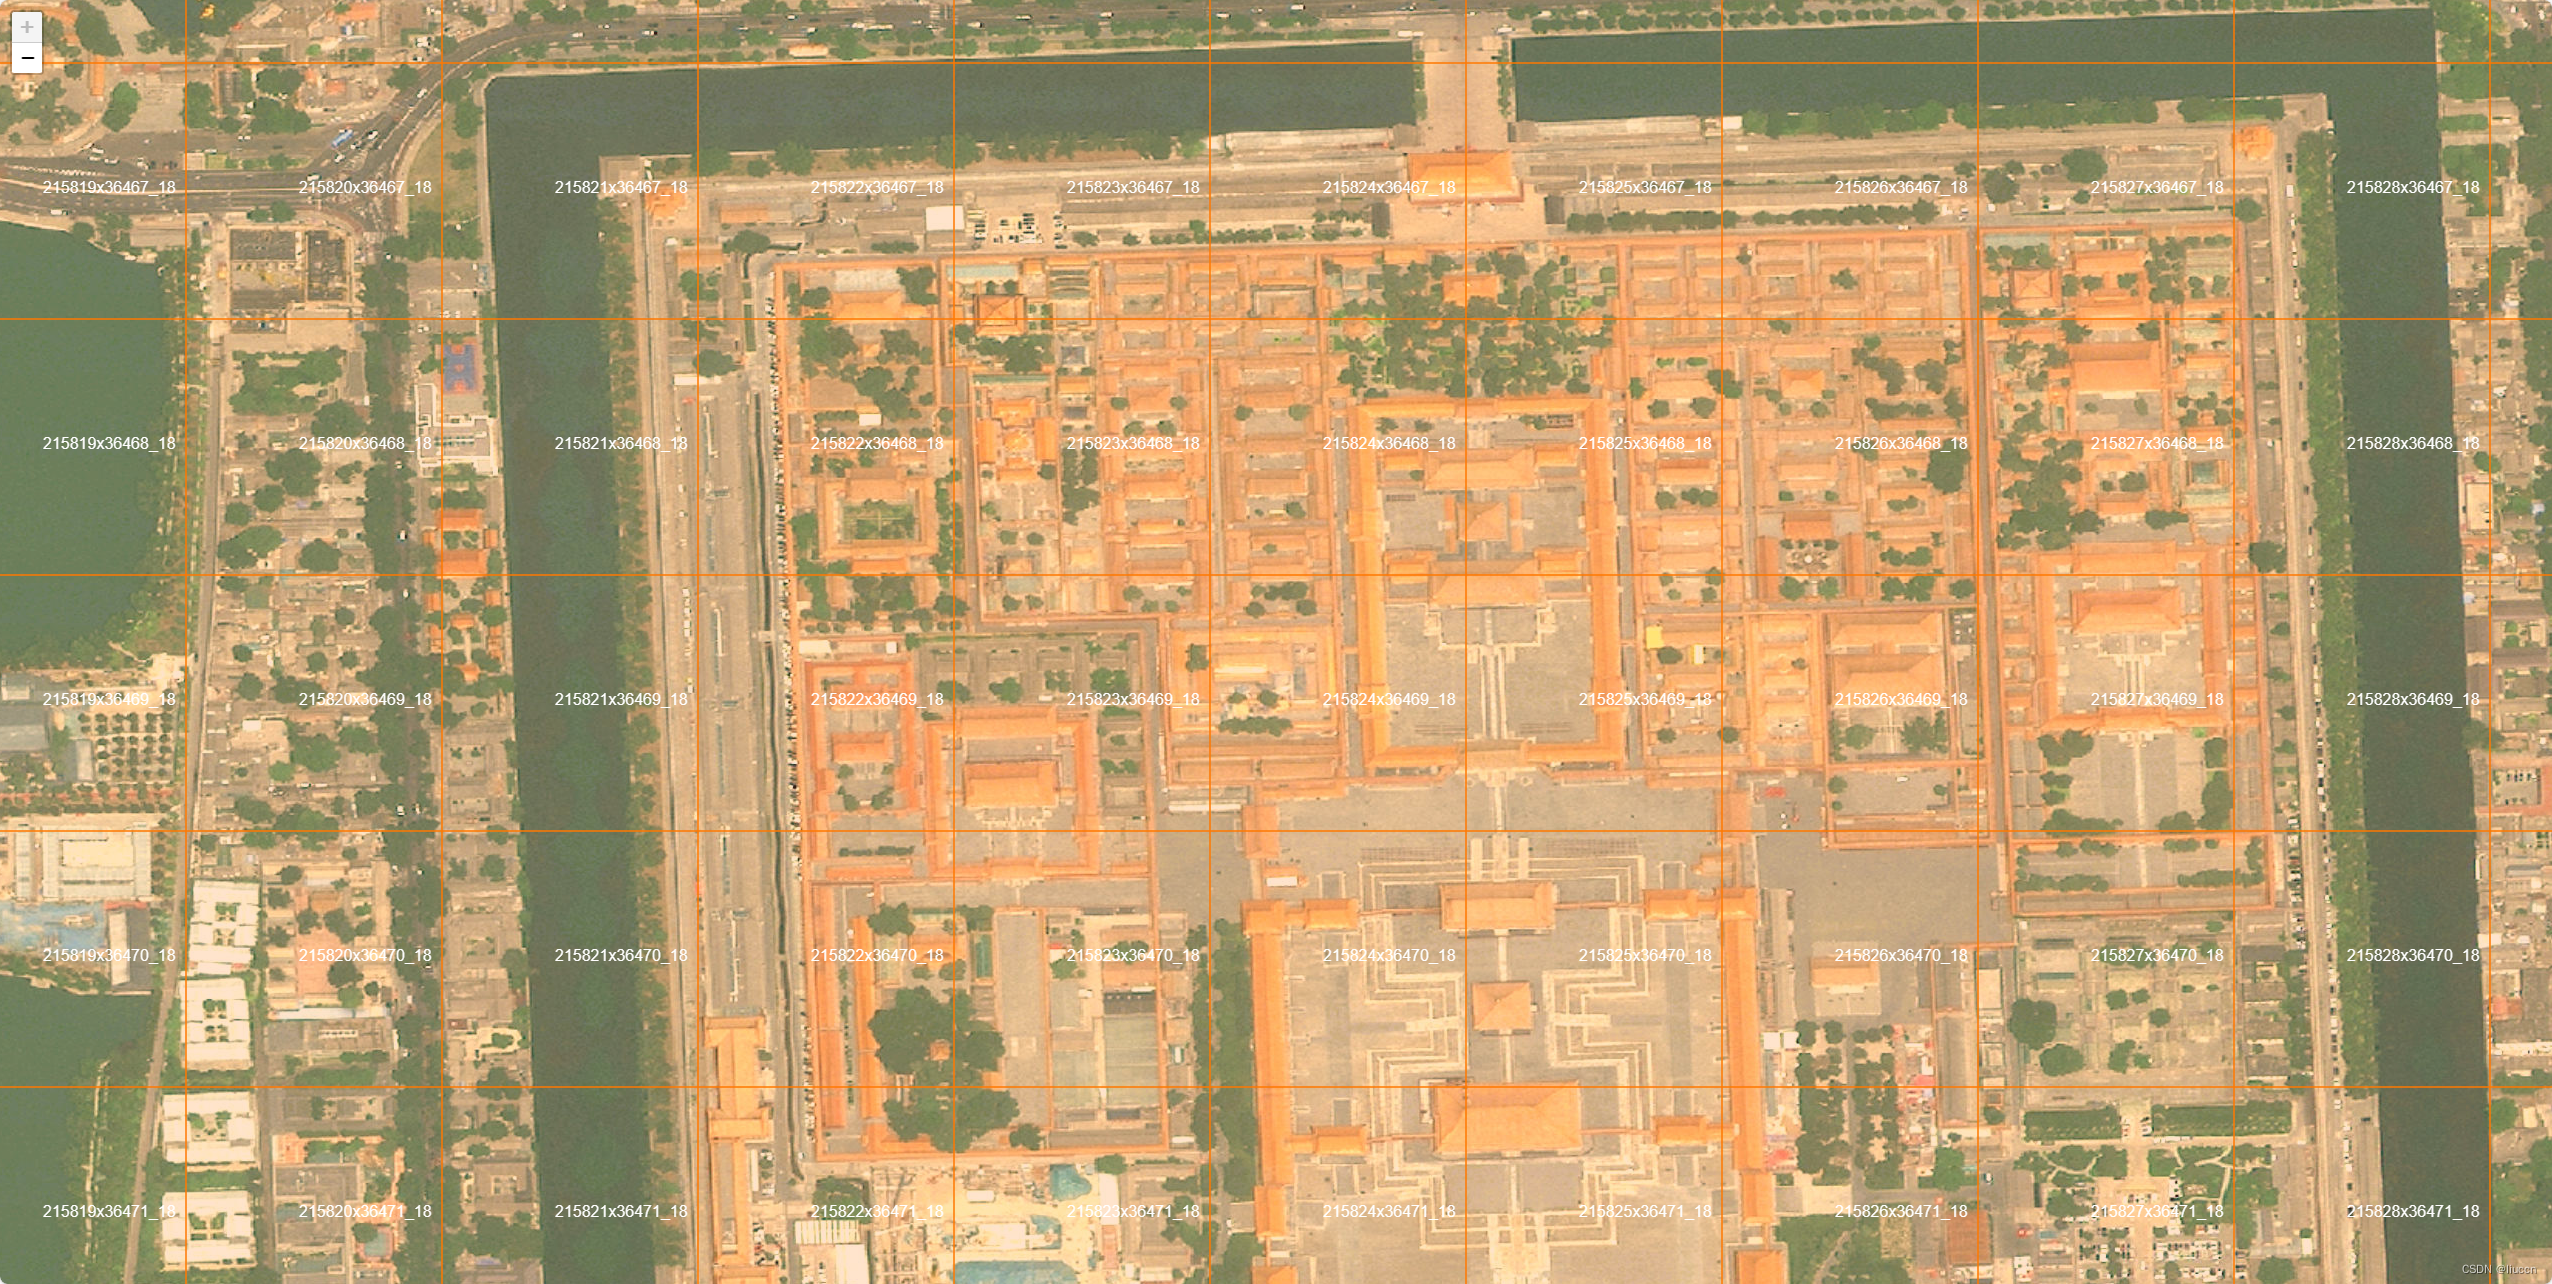
效果
参考:
leaflet 叠加天地图经纬度瓦片绘制网格


 2602
2602


 被折叠的 条评论
为什么被折叠?


