


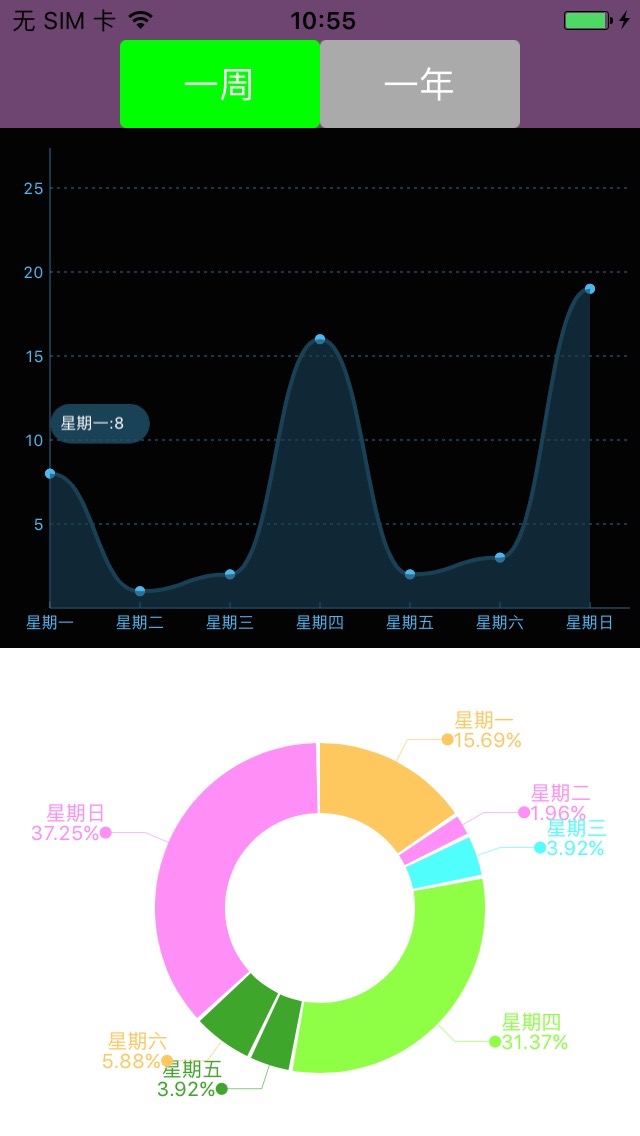
项目中使用到很多图表功能,网上找了一些第三方,感觉 PHChart 这个还不错,简洁,实用。个人项目的需要对 PHChart 做了部分修改,上图

/************************** 初始化数据 ********************/
-(NSArray *)daysArr
{
if (_daysArr == nil) {
_daysArr = @[@"8",@"1",@"2",@"16",@"2",@"3",@"19"];
}
return _daysArr;
}
-(NSArray*)monthsTitlesArr
{
if (_monthsArr == nil) {
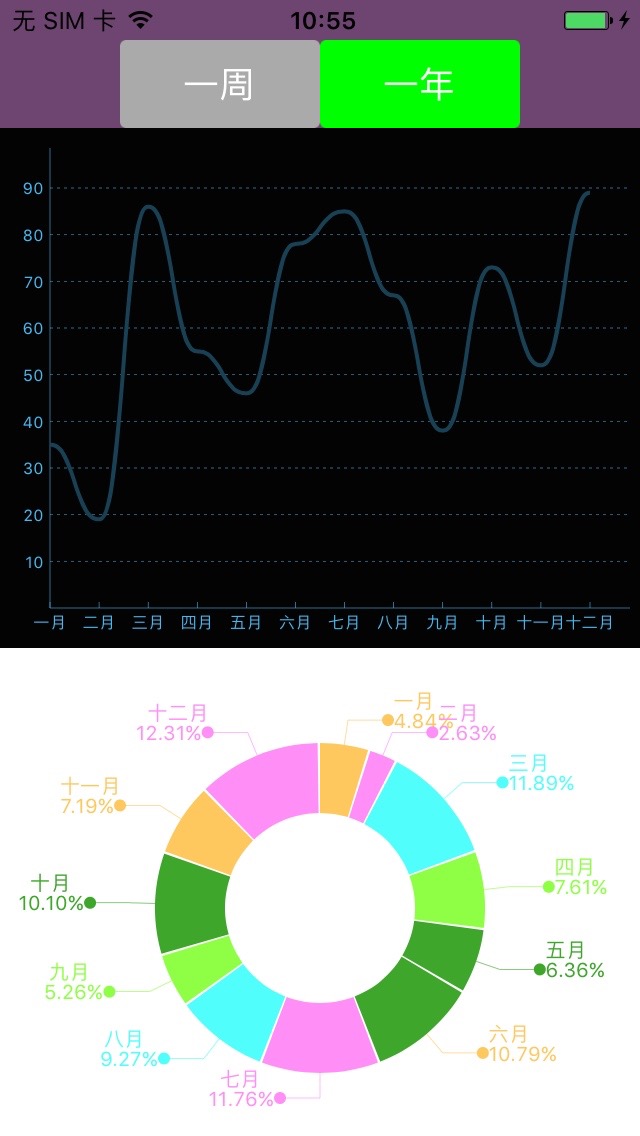
_monthsArr = @[@"一月",@"二月",@"三月",@"四月",@"五月",@"六月",@"七月",@"八月",@"九月",@"十月",@"十一月",@"十二月"];
}
return _monthsArr;
}
-(NSArray*)daysTitlesArr
{
if (_daysTitlesArr == nil) {
_daysTitlesArr = @[@"星期一",@"星期二",@"星期三",@"星期四",@"星期五",@"星期六",@"星期日"];
}
return _daysTitlesArr;
}
-(NSArray*)monthsArr
{
if (_monthsTitlesArr == nil) {
_monthsTitlesArr = @[@"35",@"19",@"86",@"55",@"46",@"78",@"85",@"67",@"38",@"73",@"52",@"89"];
}
return _monthsTitlesArr;
}
- (void)viewDidLoad {
[super viewDidLoad];
[self setUpNavView];
[self drawLineChart];
[self drawPresentChart:self.daysArr titles:self.daysTitlesArr];
}
/********************** 绘制曲线图 *************************/
-(void)drawLineChart
{
UIView* chargeBgView = [[UIView alloc] initWithFrame:CGRectMake(0, 64, k_MainBoundsWidth, 260)];
chargeBgView.backgroundColor = [UIColor colorWithRed:3 / 255.0 green:3 / 255.0 blue:3 / 255.0 alpha:1.0];
[self.view addSubview:chargeBgView];
/* Create object */
JHLineChart *lineChart = [[JHLineChart alloc] initWithFrame:CGRectMake(0, 74, k_MainBoundsWidth, 250) andLineChartType:JHChartLineValueNotForEveryX];
lineChart.hasPoint = NO;
lineChart.xLineDataArr = [self.daysTitlesArr copy];
lineChart.contentInsets = UIEdgeInsetsMake(0, 25, 20, 10);
lineChart.lineChartQuadrantType = JHLineChartQuadrantTypeFirstQuardrant;
lineChart.valueArr = @[@[],self.daysArr];
lineChart.showYLevelLine = YES;
lineChart.showYLine = YES;
lineChart.showValueLeadingLine = NO;
lineChart.showLevePoint = NO;
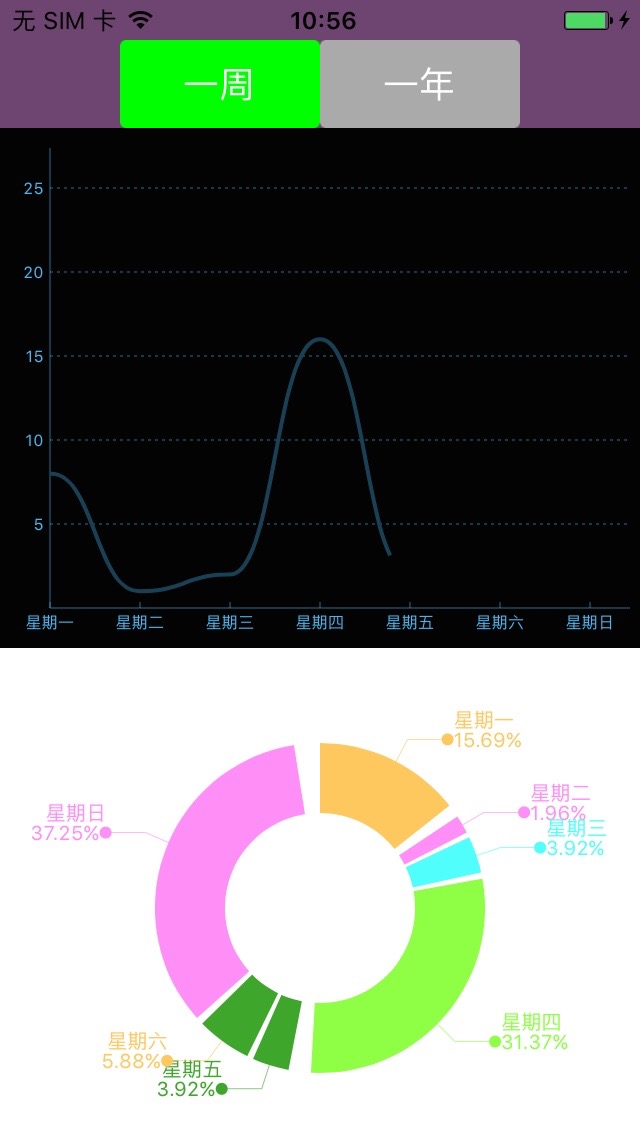
lineChart.showAnimationDuration = 1.5;
lineChart.valueFontSize = 9.0;
lineChart.backgroundColor = [UIColor colorWithRed:3 / 255.0 green:3 / 255.0 blue:3 / 255.0 alpha:1.0];
/* Line Chart colors */
lineChart.valueLineColorArr =@[ k_PointColor, k_PointColor];
/* Colors for every line chart*/
lineChart.pointColorArr = @[[UIColor colorWithRed:71 / 255.0 green:184 / 255.0 blue:240 / 255.0 alpha:1.0],[UIColor colorWithRed:71 / 255.0 green:184 / 255.0 blue:240 / 255.0 alpha:1.0]];
/* color for XY axis */
lineChart.xAndYLineColor = [UIColor colorWithRed:71 / 255.0 green:184 / 255.0 blue:240 / 255.0 alpha:1.0];
/* XY axis scale color */
lineChart.xAndYNumberColor = [UIColor colorWithRed:71 / 255.0 green:184 / 255.0 blue:240 / 255.0 alpha:1.0];
/* 设置每个点的字体颜色 */
lineChart.pointNumberColorArr = @[[UIColor colorWithRed:71 / 255.0 green:184 / 255.0 blue:240 / 255.0 alpha:1.0],[UIColor colorWithRed:71 / 255.0 green:184 / 255.0 blue:240 / 255.0 alpha:1.0]];
/* Dotted line color of the coordinate point 每个点 x y 轴直线 */
lineChart.positionLineColorArr = @[[UIColor blueColor],[UIColor greenColor]];
/* Set whether to fill the content, the default is False */
lineChart.contentFill = YES;
/* Set whether the curve path */
lineChart.pathCurve = YES;
/* Set fill color array */
lineChart.contentFillColorArr = @[[UIColor colorWithRed:0 green:0.5 blue:0 alpha:0.6],[UIColor colorWithRed:25 / 255.0 green:65 / 255.0 blue:86 / 255.0 alpha:0.6]];
[self.view addSubview:lineChart];
self.lineChart = lineChart;
/* Start animation */
[lineChart showAnimation];
}
-(void)drawPresentChart:(NSArray*)valueDataArr titles:(NSArray*)titleArr
{
JHRingChart *ring = [[JHRingChart alloc] initWithFrame:CGRectMake(0, 324, k_MainBoundsWidth, k_MainBoundsWidth)];
/* background color */
ring.backgroundColor = [UIColor whiteColor];
/* Data source array, only the incoming value, the corresponding ratio will be automatically calculated */
ring.valueDataArr = [valueDataArr copy];
ring.valueDataTitlesArr = titleArr;
/* Width of ring graph */
ring.ringWidth = 35.0;
/* Fill color for each section of the ring diagram */
ring.fillColorArray = @[[UIColor colorWithRed:1.000 green:0.783 blue:0.371 alpha:1.000], [UIColor colorWithRed:1.000 green:0.562 blue:0.968 alpha:1.000],[UIColor colorWithRed:0.313 green:1.000 blue:0.983 alpha:1.000],[UIColor colorWithRed:0.560 green:1.000 blue:0.276 alpha:1.000],[UIColor colorWithRed:0.239 green:0.651 blue:0.170 alpha:1.000],[UIColor colorWithRed:0.239 green:0.651 blue:0.170 alpha:1.000]];
/* Start animation */
[ring showAnimation];
[self.view addSubview:ring];
self.ringChart = ring;
}


 2063
2063

 被折叠的 条评论
为什么被折叠?
被折叠的 条评论
为什么被折叠?
 到【灌水乐园】发言


