


ICer wave edit--waveDorm
在ICer新入职之初,需要进行画波形图来进行理解、串讲和指导等目的;
最开始问我早入职一年的前辈,问她是怎么画的波形图,最初她是用excel,然后用timegen;
timegen对新入职选手非常友好,因为方便,入门方便;后来我的Mentor讲解了一个用JSON格式来画波形工具,当时一直觉得不错,但是却一直没有实践,这次工作需求非常大了;
1 Intro waveDorm
waveDorm是用JS写的基于JSON格式描述数字波形图的解析的开发应用;
wavedorm renders the diagrams directly inside the browser.
Core: Element ‘signal’ is an array of WaveLanes. Each WaveLanes has two mandatory fields:“name” and “wave”;
2 Most often used
2.1 The Signal
首先创建一行信号:
{signal:	[
	{ name: "Alfa", wave: "01..0.1" }
]
}

Meanning: every charater in the “wave” string represents a single time period.“.” extends previous state for one more repeat period.
2.2 Adding clock
We all know that clock is a very special signal.it will changes twice per time.
{ signal: [
  { name: "pclk", wave: 'p.......' },
  { name: "Pclk", wave: 'P.......' },
  { name: "nclk", wave: 'n.......' },
  { name: "Nclk", wave: 'N.......' },
  {},
  { name: 'clk0', wave: 'phnlPHNL' },
  { name: 'clk1', wave: 'xhlhLHl.' },
  { name: 'clk2', wave: 'hpHplnLn' },
  { name: 'clk3', wave: 'nhNhplPl' },
  { name: 'clk4', wave: 'xlh.L.Hx' },
]}
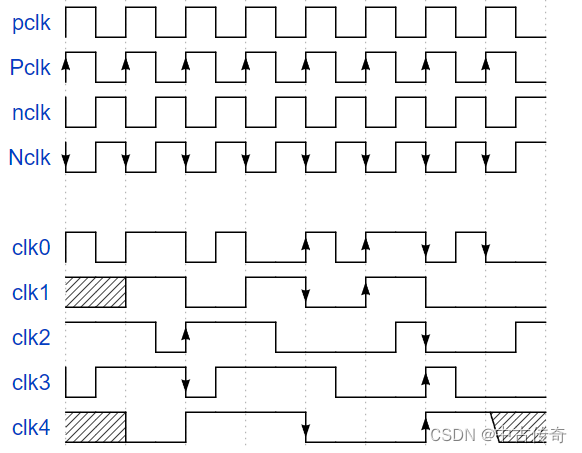
根据下图还是很容易理解:
n/p:首先是代表clk,分别是区分上升沿/下降沿开始;
N/P: 在上面基础上加上箭头;
这是两个最经常使用的
##2.3 Add Bus
Bus will try to grab the labels from ‘data’ filed.
{ signal: [
  { name: "clk",         wave: "p.....|..." },
  { name: "bus",  wave: "x.==.==.x", data: ["head", "body", "tail", "data"] }
]}
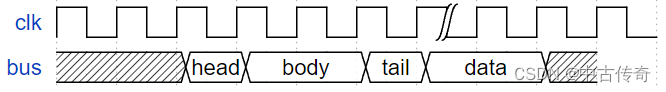
对于Bus信号:x代表不定态,=代表一个bus值,后面data里面是标签;
2.4 Add Spaces and Gaps
Add spaces and gaps in the waveform.
{ signal: [
  { name: "clk",         wave: "p.....|..." },
  { name: "Data",        wave: "x.345x|=.x", data: ["head", "body", "tail", "data"] },
  { name: "Request",     wave: "0.1..0|1.0" },
  {},
  { name: "Acknowledge", wave: "1.....|01." }
]}
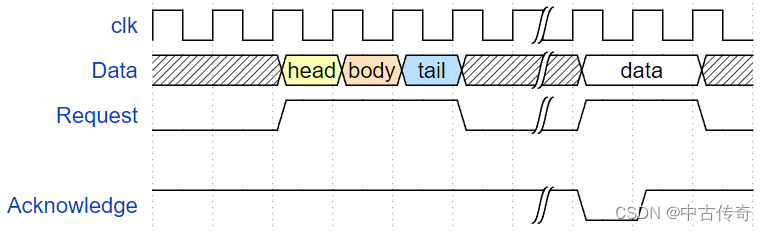
这里bus中的3,4,5代替掉“=”,再加上颜色进行区分;3,4,5==>“===”
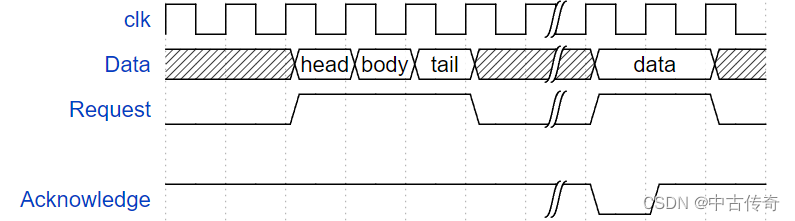
以上介绍了使用WaveDorm来描述时序波形图的绝大多数功能–能覆盖90%的使用需求;


 1414
1414

 被折叠的 条评论
为什么被折叠?
被折叠的 条评论
为什么被折叠?
 到【灌水乐园】发言


