


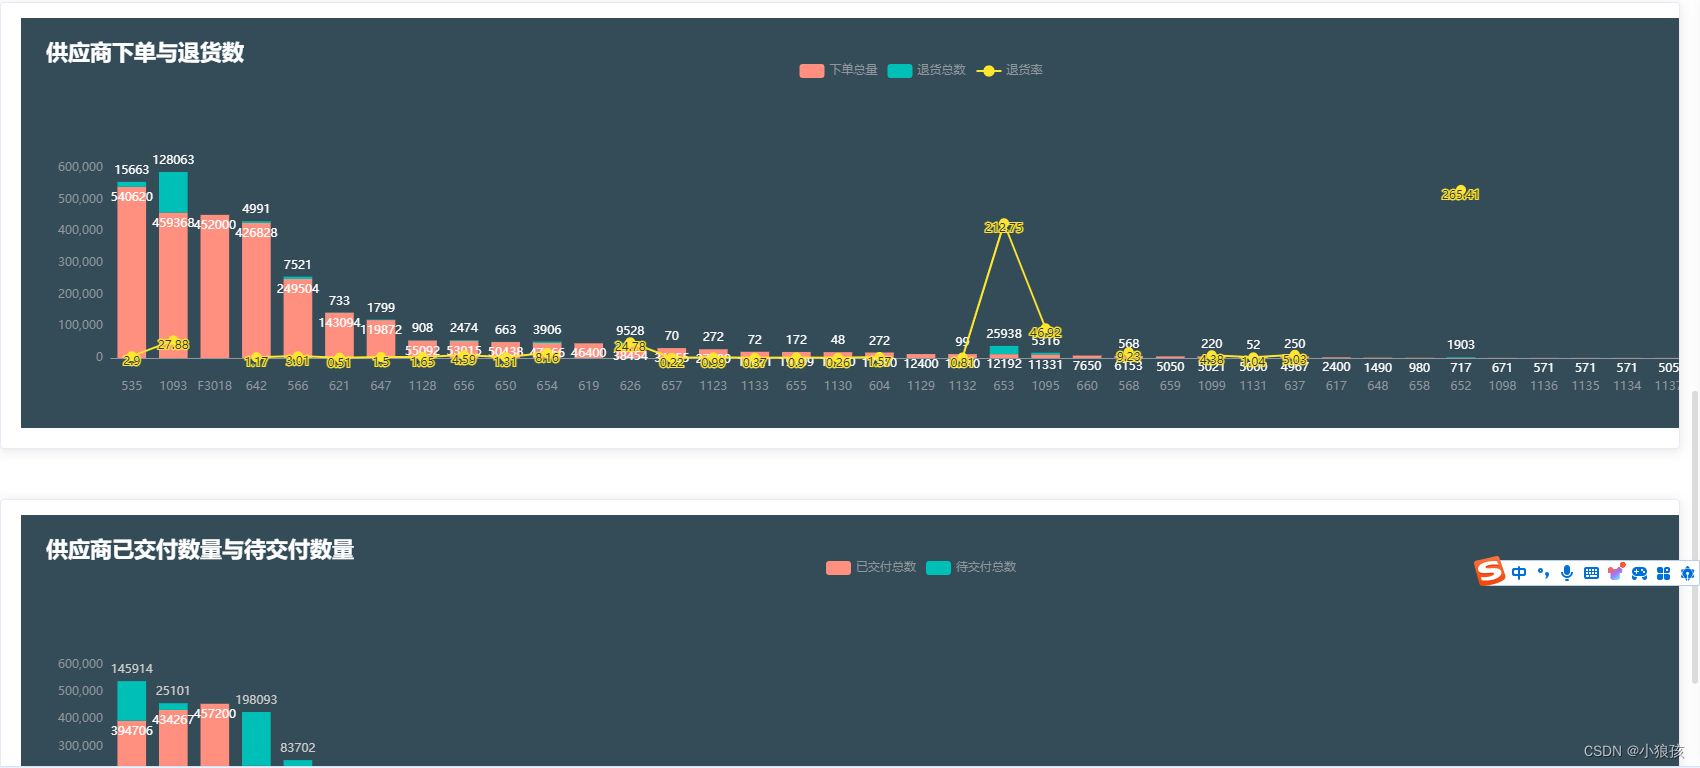
vue2+element-ui(若依)柱状图结合折线图组件封装
父组件
<template>

 <div>
      <el-card style="margin-top: 50px">
        <MinChart
          :id="'MinChart'"
          :minchartData="echartDataMin"
          width="1800px"
          height="410px"
        ></MinChart>
      </el-card>
      <el-card style="margin-top: 50px">
        <MixChart
          :id="'MixChart'"
          :chartData="echartData"
          width="1800px"
          height="410px"
        ></MixChart>
      </el-card>
    </div>

</template>
js代码
data() {
    return {
      wmsList: [],
      echartData: {
        // order: {
        xData: [],
        female: [],
        male: [],
      },
      echartDataMin: {
        // order: {
        xData: [],
        female: [],
        male: [],
        average: [],
      },
     },
methods:{
//图
    getselectPurchaseOverallList(obj) {
      purchaseOverallStatistics(obj).then((response) => {
        this.echartDataMin.xData = response.map((item) => item.supplier);
        //下单总量
        this.echartDataMin.female = response.map(
          (item) => item.totalOrderQuantity
        );
        //退货总数
        this.echartDataMin.male = response.map((item) => item.returnQuantity);
        //销量
        this.echartDataMin.average = response.map((item) => item.returnRate);

        this.echartData.xData = response.map((item) => item.supplier);
        //下单总量
        this.echartData.female = response.map((item) => item.quantityReceived);
        //退货总数
        this.echartData.male = response.map(
          (item) => item.unSkuStorageQuantity
        );
}
封装组件(子组件)
<template>
  <div :id="id" :class="className" :style="{ height: height, width: width }" />
</template>

<script>
import * as echarts from "echarts";
import resize from "./mixins/resize";

export default {
  mixins: [resize],
  props: {
    className: {
      type: String,
      default: "chart",
    },
    id: {
      type: String,
      default: "chart",
    },
    width: {
      type: String,
      default: "200px",
    },
    height: {
      type: String,
      default: "200px",
    },
    minchartData: {
      type: Object,
      default() {
        return {
          xData: [],
          female: [],
          male: [],
          average: [],
        };
      },
    },
  },
  data() {
    return {
      chart: null,
    };
  },
  watch: {
    minchartData: {
      handler: function () {
        this.initChart();
      },
      deep: true,
    },
  },
  mounted() {
    this.initChart();
  },
  beforeDestroy() {
    if (!this.chart) {
      return;
    }
    this.chart.dispose();
    this.chart = null;
  },
  methods: {
    initChart() {
      this.chart = echarts.init(document.getElementById(this.id));

      this.chart.setOption({
        backgroundColor: "#344b58",
        title: {
          text: "供应商下单与退货数",
          x: "20",
          top: "20",
          textStyle: {
            color: "#fff",
            fontSize: "22",
          },
          subtextStyle: {
            color: "#90979c",
            fontSize: "16",
          },
        },
        tooltip: {
          trigger: "axis",
          axisPointer: {
            textStyle: {
              color: "#fff",
            },
          },
        },
        grid: {
          left: "5%",
          right: "5%",
          borderWidth: 0,
          top: 150,
          // bottom: 95,
          textStyle: {
            color: "#fff",
          },
        },
        legend: {
          // x: "5%",
          top: "10%",
          textStyle: {
            color: "#90979c",
          },
          data: ["下单总量", "退货总数", "退货率"],
        },
        calculable: true,
        xAxis: [
          {
            type: "category",
            axisLine: {
              lineStyle: {
                color: "#90979c",
              },
            },
            splitLine: {
              show: false,
            },
            axisTick: {
              show: false,
            },
            splitArea: {
              show: false,
            },
            axisLabel: {
              interval: 0,
            },
            data: this.minchartData.xData,
            offset: 15,
          },
        ],
        yAxis: [
          {
            type: "value",
            splitLine: {
              show: false,
            },
            axisLine: {
              lineStyle: {
                color: "#90979c",
              },
            },
            axisTick: {
              show: false,
            },
            axisLabel: {
              interval: 0,
            },
            splitArea: {
              show: false,
            },
          },
          {
            splitLine: { show: false },
            axisLine: {
              lineStyle: {
                color: "#B4B4B4",
              },
            },
            axisLabel: {
              formatter: "{value} ",
            },
          },
        ],
        // dataZoom: [
        //   {
        //     show: true,
        //     height: 30,
        //     xAxisIndex: [0],
        //     bottom: 30,
        //     start: 10,
        //     end: 80,
        //     handleIcon:
        //       "path://M306.1,413c0,2.2-1.8,4-4,4h-59.8c-2.2,0-4-1.8-4-4V200.8c0-2.2,1.8-4,4-4h59.8c2.2,0,4,1.8,4,4V413z",
        //     handleSize: "110%",
        //     handleStyle: {
        //       color: "#d3dee5",
        //     },
        //     textStyle: {
        //       color: "#fff",
        //     },
        //     borderColor: "#90979c",
        //   },
        //   {
        //     type: "inside",
        //     show: true,
        //     height: 15,
        //     start: 1,
        //     end: 35,
        //   },
        // ],
        series: [


          {
            name: "下单总量",
            type: "bar",
            stack: "total",
            itemStyle: {
              normal: {
                color: "rgba(255,144,128,1)",
                barBorderRadius: 0,
                label: {
                  show: true,
                  textStyle: {
                    color: "#fff",
                  },
                  position: "insideTop",
                  formatter(p) {
                    return p.value > 0 ? p.value : "";
                  },
                },
              },
            },
            data: this.minchartData.female,
          },
          {
            name: "退货总数",
            type: "bar",
            stack: "total",
            barMaxWidth: 35,
            barGap: "10%",
            itemStyle: {
              normal: {
                color: "rgba(0,191,183,1)",

                label: {
                  show: true,
                  textStyle: {
                    color: "#fff",
                  },
                  position: "top",
                  formatter(p) {
                    return p.value > 0 ? p.value : "";
                  },
                },
              },
            },
            data: this.minchartData.male,
          },
          {
            name: "退货率",
            type: "line",
            // stack: "total",
            symbolSize: 10,
            symbol: "circle",
            yAxisIndex: 1,
            itemStyle: {
              normal: {
                color: "rgba(252,230,48,1)",
                barBorderRadius: 0,
                label: {
                  show: true,

                  position: "insideTop",
                  formatter(p) {
                    return p.value > 0 ? p.value : "";
                  },
                },
              },
            },
            tooltip: {
              valueFormatter: function (value) {
                return value + " %";
              },
            },
            data: this.minchartData.average,
          },
        ],
      });


    },
  },
};
</script>
resize.js
import { debounce } from '@/utils'

export default {
  data() {
    return {
      $_sidebarElm: null,
      $_resizeHandler: null
    }
  },
  mounted() {
    this.initListener()
  },
  activated() {
    if (!this.$_resizeHandler) {
      // avoid duplication init
      this.initListener()
    }

    // when keep-alive chart activated, auto resize
    this.resize()
  },
  beforeDestroy() {
    this.destroyListener()
  },
  deactivated() {
    this.destroyListener()
  },
  methods: {
    // use $_ for mixins properties
    // https://vuejs.org/v2/style-guide/index.html#Private-property-names-essential
    $_sidebarResizeHandler(e) {
      if (e.propertyName === 'width') {
        this.$_resizeHandler()
      }
    },
    initListener() {
      this.$_resizeHandler = debounce(() => {
        this.resize()
      }, 100)
      window.addEventListener('resize', this.$_resizeHandler)

      this.$_sidebarElm = document.getElementsByClassName('sidebar-container')[0]
      this.$_sidebarElm && this.$_sidebarElm.addEventListener('transitionend', this.$_sidebarResizeHandler)
    },
    destroyListener() {
      window.removeEventListener('resize', this.$_resizeHandler)
      this.$_resizeHandler = null

      this.$_sidebarElm && this.$_sidebarElm.removeEventListener('transitionend', this.$_sidebarResizeHandler)
    },
    resize() {
      const { chart } = this
      chart && chart.resize()
    }
  }
}
父组件和开头父组件代码一致,以下封装组件(子组件)
<template>
<div :id="id" :class="className" :style="{ height: height, width: width }" />
</template>
<script>
import * as echarts from "echarts";
// import echarts from 'echarts'
import resize from "./mixins/resize";
export default {
mixins: [resize],
props: {
className: {
type: String,
default: "chart",
},
id: {
type: String,
default: "chart",
},
width: {
type: String,
default: "200px",
},
height: {
type: String,
default: "200px",
},
minchartData: {
type: Object,
default() {
return {
xData: [],
female: [],
male: [],
average: [],
};
},
},
},
data() {
return {
chart: null,
};
},
watch: {
minchartData: {
handler: function () {
this.initChart();
},
deep: true,
},
},
mounted() {
this.initChart();
},
beforeDestroy() {
if (!this.chart) {
return;
}
this.chart.dispose();
this.chart = null;
},
methods: {
initChart() {
this.chart = echarts.init(document.getElementById(this.id));
// this.chart.setOption({
// backgroundColor: "#344b58",
// title: {
// // text: "尺码库销比",
// x: "20",
// top: "20",
// textStyle: {
// color: "#fff",
// fontSize: "22",
// },
// subtextStyle: {
// color: "#90979c",
// fontSize: "16",
// },
// },
// tooltip: {
// trigger: "axis",
// axisPointer: {
// textStyle: {
// color: "#fff",
// },
// },
// },
// grid: {
// left: "5%",
// right: "5%",
// borderWidth: 0,
// top: 150,
// // bottom: 95,
// textStyle: {
// color: "#fff",
// },
// },
// legend: {
// // x: "5%",
// top: "10%",
// textStyle: {
// color: "#90979c",
// },
// data: ["销售目标", "销售额", "达成率"],
// },
// calculable: true,
// xAxis: [
// {
// type: "category",
// axisLine: {
// lineStyle: {
// color: "#90979c",
// },
// },
// splitLine: {
// show: false,
// },
// axisTick: {
// show: false,
// },
// splitArea: {
// show: false,
// },
// axisLabel: {
// interval: 0,
// },
// data: this.minchartData.xData,
// },
// ],
// yAxis: [
// {
// type: "value",
// position: "left",
// splitLine: {
// show: false,
// },
// // axisLine: {
// // lineStyle: {
// // color: "#90979c",
// // },
// // },
// axisTick: {
// show: false,
// },
// axisLabel: {
// interval: 0,
// },
// splitArea: {
// show: false,
// },
// },
// {
// type: "value",
// name: "达成率",
// position: "right",
// alignTicks: true,
// axisLine: {
// show: true,
// lineStyle: {
// color: "#90979c",
// },
// },
// axisLabel: {
// formatter: "{value} %",
// },
// },
// ],
// series: [
// {
// name: "销售目标",
// type: "bar",
// barWidth: 15,
// // yAxisIndex: 1,
// yAxisIndex: 0,
// color: "#a9a3e5",
// data: this.minchartData.female,
// },
// {
// name: "销售额",
// type: "bar",
// barWidth: 15,
// // yAxisIndex: 1,
// yAxisIndex: 0,
// color: "#2c8bc5",
// data: this.minchartData.male,
// },
// {
// name: "达成率",
// type: "line",
// color: "#eab263",
// // yAxisIndex: 0,
// yAxisIndex: 1,
// data: this.minchartData.average,
// },
// ],
// });
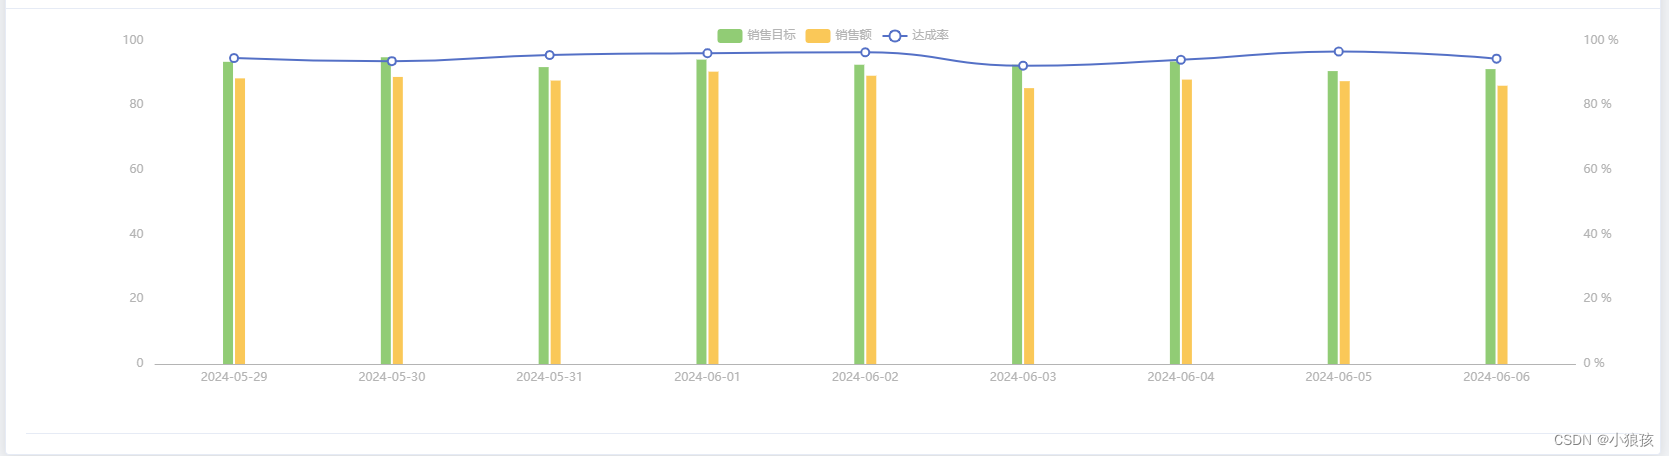
this.chart.setOption({
tooltip: {
trigger: "axis",
backgroundColor: "rgba(255,255,255,0.1)",
axisPointer: {
type: "shadow",
label: {
show: true,
backgroundColor: "#7B7DDC",
},
},
},
legend: {
data: ["销售目标", "销售额", "达成率"],
textStyle: {
color: "#B4B4B4",
},
top: "0%",
},
grid: {
x: "8%",
width: "88%",
y: "4%",
},
xAxis: {
data: this.minchartData.xData,
axisLine: {
lineStyle: {
color: "#B4B4B4",
},
},
axisTick: {
show: false,
},
},
yAxis: [
{
splitLine: { show: false },
axisLine: {
lineStyle: {
color: "#B4B4B4",
},
},
axisLabel: {
formatter: "{value} ",
},
},
{
// name: "Temperature",
splitLine: { show: false },
axisLine: {
lineStyle: {
color: "#B4B4B4",
},
},
axisLabel: {
formatter: "{value} %",
},
},
],
series: [
{
name: "达成率",
type: "line",
smooth: true,
showAllSymbol: true,
symbol: "emptyCircle",
symbolSize: 8,
yAxisIndex: 1,
// itemStyle: {
// normal: {
// color: "#F02FC2",
// },
// },
tooltip: {
valueFormatter: function (value) {
return value + " %";
},
},
data: this.minchartData.average,
},
{
name: "销售目标",
type: "bar",
barWidth: 10,
// itemStyle: {
// normal: {
// barBorderRadius: 5,
// },
// },
tooltip: {
valueFormatter: function (value) {
return value + " 万";
},
},
data: this.minchartData.female,
},
{
name: "销售额",
type: "bar",
// barGap: "-100%",
barWidth: 10,
tooltip: {
valueFormatter: function (value) {
return value + " 万";
},
},
// itemStyle: {
// normal: {
// barBorderRadius: 5,
// },
// },
z: -12,
data: this.minchartData.male,
},
],
});
this.chart.on("click", this.handleClick);
},
handleClick(params) {
this.$emit("SetLineChartData", params.dataIndex);
},
},
};
</script>
SetLineChartData方法传递到父组件,子组件中当前点击事件
 <MinChart
                :id="'echartDataMin'"
                :minchartData="echartDataMin"
                height="410px"
                width="100%"
                @SetLineChartData="SetLineChartData"
              />


 1141
1141

 被折叠的 条评论
为什么被折叠?
被折叠的 条评论
为什么被折叠?
 到【灌水乐园】发言


