


文章目录
前言
本文写的主要是prometheus各个组件的概要部署,详细各个组件实现的功能详见具体文章
设计方案:

方案概要:
采集区的各个exporter作为各个功能的采集器,每隔一段时间采集自己相应的数据,consul最为注册服务组件,将各个监控目标注册到consul上,以便于prometheus的动态发现。Prometheus拉取各个监控指标、比对规则、将数据存于tsdb(默认,本次设计采用influxdb远方存储),并将异常的指标抛给alertmanger。Alertmanager则配置相应的告警(本设计为微信告警),Grafana用于展示相关监控指标。具体各个组件的详细功能见第4步的组件详解.
2、prometheus监控系统搭建
1、安装环境准备
1.1 关闭selinux
sed -i ‘s/SELINUX=enforcing/SELINUX=disabled/g’ /etc/selinux/config
setenforce 0
1.2 安装go环境
下载go的安装包,解压到/usr/local 目录下
tar -xvf go1.11.5.linux-amd64.tar.gz -C /usr/local/
配置环境变量
cat >>/etc/profile<<EOF
export PATH=$PATH:/usr/local/go/bin
EOF
source /etc/profile
go version
1.3 系统主机时间、时区、系统语言
若有ntp服务则忽略此步
修改时区
ln -sf /usr/share/zoneinfo/Asia/Shanghai /etc/localtime
修改系统语言环境
echo ‘LANG=“en_US.UTF-8”’ >> /etc/profile && source /etc/profile
配置主机NTP时间同步
yum -y install ntp
systemctl enable ntpd && systemctl start ntpd
echo ‘server ntp1.aliyun.com’ >> /etc/ntp.conf
echo ‘server ntp2.aliyun.com’ >> /etc/ntp.conf
若机器无法访问外网,则在一台服务器上装ntp服务,并将另外几台服务器设置为该服务器的客户端。
安装ntp服务(下载ntpd rpm包)此处忽略
设置ntp server
vi /etc/ntp.conf
driftfile /var/lib/ntp/drift
restrict default kod nomodify notrap nopeer noquery
restrict -6 default kod nomodify notrap nopeer noquery
restrict 127.0.0.1
restrict -6 ::1
#允许192.168.6网段机器同步时间
restrict 192.168.6.0 mask 255.255.255.0 nomodify notrap
#远程时间服务器的地址
server 210.72.145.44 perfer #中国国家授时中心
server 1.cn.pool.ntp.org
#允许上层服务器主动修改本机时间
restrict 210.72.145.44 nomodify notrap noquery
restrict 1.cn.pool.ntp.ofg nomodify notrap noquery
#外部时间服务器不可用时,以本地时间作为时间服务
server 127.127.1.0
fudge 127.127.1.0 stratum 10
includefile /etc/ntp/crypto/pw
keys /etc/ntp/keys
4.设置NTP client
设置个crontab 每分钟执行ntpd ntp server ip即可
3、prometheus安装
- 下载&部署
#下载
[root@prometheus src]# cd /usr/local/src/
[root@prometheus src]# wget https://github.com/prometheus/prometheus/releases/download/v2.0.0/prometheus-2.0.0.linux-amd64.tar.gz
#部署到/usr/local/目录
#promethus不用编译安装,解压目录中有配置文件与启动文件
[root@prometheus src]# tar -zxvf prometheus-2.0.0.linux-amd64.tar.gz -C /usr/local/
[root@prometheus src]# cd /usr/local/
[root@prometheus local]# mv prometheus-2.0.0.linux-amd64/ prometheus/
mkdir /etc/prometheus
mkdir /var/lib/prometheus
cd /usr/local/prometheus
cp prometheus /usr/sbin/
cp promtool /usr/sbin/
cp prometheus.yml /etc/prometheus/
groupadd prometheus
useradd -g prometheus -s /sbin/nologin prometheus
chown prometheus:prometheus /usr/sbin/prometheus /usr/sbin/promtool
chown prometheus:prometheus /etc/prometheus /var/lib/prometheus/ -R
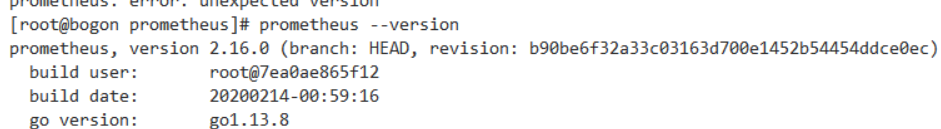
#验证
[root@prometheus prometheus]# prometheus --version
#设置开机自启动
[root@prometheus ~]# touch /usr/lib/systemd/system/prometheus.service
[root@prometheus ~]# chown prometheus:prometheus /usr/lib/systemd/system/prometheus.service
[root@prometheus ~]# vim /usr/lib/systemd/system/prometheus.service
[Unit] Description=Prometheus Documentation=https://prometheus.io/ After=network.target [Service]
#Type设置为notify时,服务会不断重启 Type=simple User=prometheus ExecStart=/usr/sbin/prometheus  \
     --config.file=/etc/prometheus/prometheus.yml \
     --storage.tsdb.path=/var/lib/prometheus            \
     --web.console.templates=/etc/prometheus/consoles \
     --web.console.libraries=/etc/prometheus/console_libraries   Restart=on-failure [Install] WantedBy=multi-user.target
[root@prometheus ~]# systemctl enable prometheus
[root@prometheus ~]# systemctl start prometheus
开放端口
firewall-cmd --zone=public --add-port=9090/tcp --permanent
配置prometheus查询日志切割(有配置 query_log_file: /var/log/prometheus.log)
cat /etc/logrotate.d/prometheus
/var/log/prometheus.log {
create 0644 prometheus prometheus
daily
rotate 7
missingok
notifempty
dateext
compress
sharedscripts
postrotate
ps -ef |grep prometheus.yml |grep -v grep |awk ‘{print $2}’ |xargs kill -HUP
endscript
}
4、node_exporter(wmi_exporter的安装)
centos6
tar -zxvf node_exporter-0.18.1.linux-arm64.tar.gz -C /usr/local/
mv node_exporter-0.18.1.linux-arm64 node_exporter
cd /usr/local/node_exporter/
groupadd prometheus
useradd -g prometheus -s /sbin/nologin prometheus
chown -R prometheus:prometheus /usr/local/node_exporter/
启动脚本:
cat start-node_exporter.sh
cd /usr/local/node_exporter
nohup ./node_exporter >>/var/log/node_exporter.log &
日志切割:(如有必要)
cat /etc/logrotate.d/node_exporter
/var/log/node_exporter.log {
create 644 root root
daily
rotate 7
missingok
notifempty
dateext
sharedscripts
postrotate
ps -ef |grep node_exporter |grep -v grep |awk ‘{print $2}’ |xargs kill -HUP
endscript
}
centos7:
下载地址:https://github.com/prometheus/node_exporter/releases
安装
tar -zxvf node_exporter-0.18.1.linux-arm64.tar.gz -C /usr/local/
mv node_exporter-0.18.1.linux-arm64 node_exporter
设置组用户
groupadd prometheus
useradd -g prometheus -s /sbin/nologin prometheus
chown -R prometheus:prometheus /usr/local/node_exporter/
设置开机自启动脚本
cat /usr/lib/systemd/system/node_exporter.service
[Unit]
Description=node_exporter
Documentation=https://prometheus.io/
After=network.target
[Service]
Type=simple
User=prometheus
ExecStart=/usr/local/node_exporter/node_exporter
Restart=on-failure
[Install]
WantedBy=multi-user.target
systemctl enable node_exporter.service
systemctl start node_exporter.service
访问日志数据:
http://192.168.14.160:9100/metrics
windows
安装msi安装包即可
设置iptables
firewall-cmd --zone=public --add-port=9100/tcp --permanent
 最低0.47元/天 解锁文章


 4554
4554


 被折叠的 条评论
为什么被折叠?
被折叠的 条评论
为什么被折叠?
 到【灌水乐园】发言


