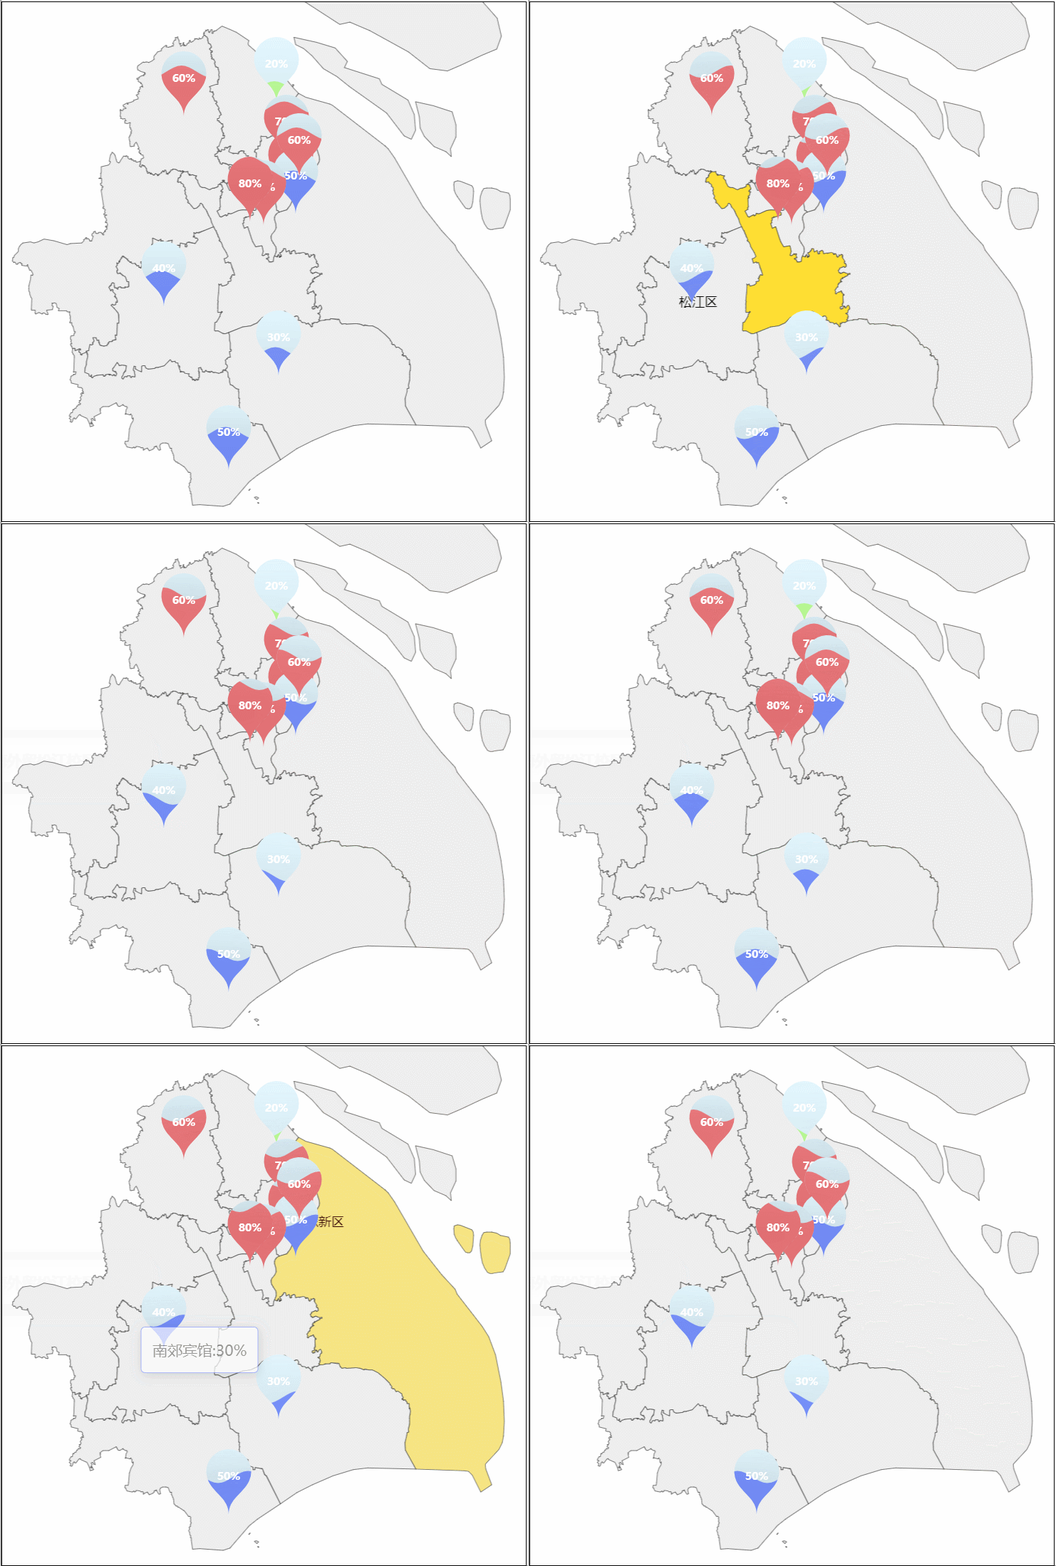
B站看到这张图,很想学习一下,给up发了私信,可是截止到现在还没有回复,我打算自己先动手研究一下,也是一个学习知识的好机会。

实现思路:
刚开始的思路是,底图是3D地图,然后上面放水球图,但是水球图并不支持geo坐标,然后寻思着是地图上加散点,然后将散点的symbol设置为gif图,但是我没有美工帮我做这种图,只能作罢,而且就算有美工作图,清晰度不见得很好,symbol也不一定支持gif。
继续思考,想用label的回调函数,返回html格式,结果发现label不支持返回html,又想着tooltip的回调函数可以支持html格式,我用html格式做一个水球图,并且也找到了html做水球图的方法,但是最后发现仅仅支持简单的文字内容,复杂样式根本不起作用。
继续百度,在CSDN上输入关键字echarts html,发现一篇文章讲如何将一个html元素添加到echarts上去,参考这篇文章,结合官网的文档,又学到了一个新的方法: convertToPixel。
通过这个方法,我们可以将geo坐标转换成页面的像素坐标,然后使用绝对定位,将元素定在这个坐标上。
但是,我发现,如果底图为geo3D,坐标就无法转换,改成geo,就可以转换了,暂时就只能使用geo了。
我做的第一版,是用html方法做水球图,然后定位到地图上,但是水波的位置不能根据数据变化(比如50%的时候,水波在中间,80%的时候水波快满了),于是继续研究,才实现了将水球图定位到地图上的效果,如果要显示的数据并不是百分比,比如水位12米这种,那我们使用html做水球图也是很好的。

实现过程:
首先,我们在父组件上画geo底图,然后通过v-for循环生成N个水球图,把水球图需要的数据通过自定义属性传给子组件(水球图自定义组件),担心echarts生成图表的时候div的id重复,所以将id也通过自定义属性传过来,保证每个div的id都不同。


本来打算在水球图组件里设置坐标,但是一直提示找不到geo,所以就把坐标设置放在父组件页面了。

水球图都定位好后,我们再在geo上加跟水球图位置一样的散点图,目的是校正水球图的坐标,这个手动慢慢调就行了。
最终效果:

遗留问题:
水球图的tooltip,只有鼠标放到水波里,才会显示,但是如果数据很小,比如20%,鼠标就很难放到水波里,水波实在太小了。
代码:
数据代码:
[{
		"type": 1,
		"status": 0,
		"percent":0.2,
		"name": "上海市卫生监督所",
		"value": [121.478481, 31.402116, 100]
	},
	{
		"type": 1,
		"status": 0,
		"percent":0.6,
		"name": "瑞金医院",
		"value": [121.263544, 31.378035, 100]
	},
	{
		"type": 1,
		"status": 0,
		"percent":0.7,
		"name": "上海市肺科医院",
		"value": [121.502006, 31.301688, 100]
	},
	{
		"type": 1,
		"status": 0,
		"percent":0.8,
		"name": "上海市东方医院",
		"value": [121.512287, 31.237613, 100]
	},
	{
		"type": 1,
		"status": 0,
		"percent":0.5,
		"name": "上海交通大学医院",
		"value": [121.522361, 31.206991, 100]
	},
	{
		"type": 1,
		"status": 0,
		"percent":0.6,
		"name": "上海市卫健委应急办",
		"value": [121.531758, 31.269437, 100]
	},
	{
		"type": 1,
		"status": 0,
		"percent":0.7,
		"name": "上海市精神卫生中心",
		"value": [121.44806, 31.187265, 100]
	},
	{
		"type": 1,
		"status": 0,
		"percent":0.8,
		"name": "上海市疾病预防控制中心",
		"value": [121.417922, 31.193355, 100]
	},
	{
		"type": 2,
		"status": 0,
		"percent":0.4,
		"name": "上海外贸松江校区",
		"value": [121.217376, 31.046053, 100]
	},
	{
		"type": 3,
		"status": 0,
		"percent":0.5,
		"name": "金山山阳中学",
		"value": [121.367352, 30.760275, 100]
	},
	{
		"type": 2,
		"status": 1,
		"percent":0.3,
		"name": "南郊宾馆",
		"value": [121.483558, 30.925426, 100]
	}

]
父组件代码:
<template>
	<div>
		<div id="map"></div>
		<!-- 需要定位到map中的水球图 -->
		<template v-for="(item, index) in allPositions">
			<liquidFill :index="item.index" :percent="item.percent" :name="item.name" :style="{left:item.left,top:item.top}"></liquidFill>
		</template>
	</div>
</template>

<script>
	import * as echarts from 'echarts'
	import 'echarts-gl'
	import mapJson from '@/assets/map/json/province/shanghai.json'
	import liquidFillData from '@/assets/liquidFillData.json'
	import liquidFill from './liquidFill.vue'
	export default {
		components: {
			liquidFill
		},
		data() {
			return {
				myChart:null,
				allPositions:[],
				//echart 配制option
				options: {
					geo: {
					  map: "shanghai"
					},
					// 这里的散点图只是为了更精确的调整水球图的位置,调整好为之后就可以去掉了
					// series: [
					//   {
					// 	    type: 'scatter',
					// 	    coordinateSystem: 'geo',
					// 	    symbolSize: 30,
					// 	    zlevel: 99,
					// 	    geoIndex: 0,
					// 	    silent: false,
					// 	    itemStyle: {
					// 	      opacity: 1,
					// 	      width: 1
					// 	    },
					// 	    data: [
					// 	        {
					// 	          type: 1,
					// 	          status: 0,
					// 	          name: '上海市卫生监督所',
					// 	          value: [121.478481, 31.402116, 100]
					// 	        },
					// 	        { type: 1, status: 0, name: '瑞金医院', value: [121.263544, 31.378035, 100] },
					// 	        {
					// 	          type: 1,
					// 	          status: 0,
					// 	          name: '上海市肺科医院',
					// 	          value: [121.502006, 31.301688, 100]
					// 	        },
					// 	        {
					// 	          type: 1,
					// 	          status: 0,
					// 	          name: '上海市东方医院',
					// 	          value: [121.512287, 31.237613, 100]
					// 	        },
					// 	        {
					// 	          type: 1,
					// 	          status: 0,
					// 	          name: '上海交通大学医院',
					// 	          value: [121.522361, 31.206991, 100]
					// 	        },
					// 	        {
					// 	          type: 1,
					// 	          status: 0,
					// 	          name: '上海市卫健委应急办',
					// 	          value: [121.531758, 31.269437, 100]
					// 	        },
					// 	        {
					// 	          type: 1,
					// 	          status: 0,
					// 	          name: '上海市精神卫生中心',
					// 	          value: [121.44806, 31.187265, 100]
					// 	        },
					// 	        {
					// 	          type: 1,
					// 	          status: 0,
					// 	          name: '上海市疾病预防控制中心',
					// 	          value: [121.417922, 31.193355, 100]
					// 	        },
					// 	        {
					// 	          type: 2,
					// 	          status: 0,
					// 	          name: '上海外贸松江校区',
					// 	          value: [121.217376, 31.046053, 100]
					// 	        },
					// 	        {
					// 	          type: 3,
					// 	          status: 0,
					// 	          name: '金山山阳中学',
					// 	          value: [121.367352, 30.760275, 100]
					// 	        },
					// 	        { type: 2, status: 1, name: '南郊宾馆', value: [121.483558, 30.925426, 100] }

					// 	    ],
					// 	    shading: 'lambert'
					//   }
					// ]
				}
			}
		},
		methods: {
			//初始化中国地图
			initEchartMap() {
				let mapDiv = document.getElementById('map');
				if (this.myChart != null && this.myChart != "" && this.myChart != undefined) {
				  this.myChart.dispose();
				}
				this.myChart = echarts.init(mapDiv);
				echarts.registerMap('shanghai', mapJson)
				this.myChart.setOption(this.options);
				this.allPositions = this.getPosition(liquidFillData);
			},
			// 获取每个水球图的位置
			getPosition(data){
				let positons = data.map((item,index)=>{
					// 将geo坐标转换成像素坐标
					let position = this.myChart.convertToPixel('geo', [item.value[0], item.value[1]]);
					return {
						index:'chart'+index,//水球图dom的id,保证id不重复
						percent:[item.percent],
						name:item.name,//地点的名称
						// 坐标再根据气泡的尺寸手动调整一下。
						left:(position[0]-35)+'px',
						top:(position[1]-55)+'px'
					}
				})
				return positons;
			}

		},
		created() {

		},
		destroyed() {
		  this.myChart = null;
		},
		mounted() {
			this.$nextTick(() => {
				this.initEchartMap();
			})
		}
	};
</script>

<style>
	#map {
		width: 100%;
		height: 800px;
	}
</style>
子组件代码:
<template>
	<div :id="index" style="position: absolute;width: 80px;height: 80px;"></div>
</template>

<script>
	import * as echarts from 'echarts'
	import 'echarts-liquidfill'
	export default {
		props: {
			index: '',
			percent: [],
			name: ''
		},
		data() {
			return {
				myChart: null,
				//echart 配制option
				option: {
					animation: false,
					series: [{
						type: 'liquidFill',
						radius: '80px',
						shape: 'pin',
						label: {
							color: '#fff',
							insideColor: 'transparent',
							textStyle: {
								fontSize: 10,
								fontWeight: 'bold',
							}
						},
						outline: {
							show: true,
							borderDistance: 5,
							itemStyle: {
								borderColor: 'rgba(67,209,100,1)',
								borderWidth: 0
							}
						}

					}]
				}
			}
		},
		methods: {
			initEchart() {
				var mapDiv = document.getElementById(this.index);
				if (this.myChart != null && this.myChart != "" && this.myChart != undefined) {
					this.myChart.dispose();
				}
				this.myChart = echarts.init(mapDiv);
				// 生成chart
				this.option.series[0].data = [this.percent];
				if(this.percent>0.5){
					this.option.series[0].color = ['rgba(255,0,0,0.5)']
				}else if(this.percent<0.3){
					this.option.series[0].color = ['rgba(143, 255, 39, 0.5)']
				}else{
					this.option.series[0].color = ['rgba(12, 44, 255, 0.5)']
				}
				this.option.series[0].name = this.name;
				this.option.tooltip = {
					show: true,
					triggerOn:'mousemove',
					formatter: function(params) {
						let tip = params.seriesName +":"+params.value[0] * 100 + '%';
						return tip;
					}
				}
				this.myChart.setOption(this.option);
			}

		},
		created() {

		},
		destroyed() {
			this.myChart = null;
		},
		mounted() {
			this.initEchart();
		}
	};
</script>

<style scoped>

</style>
参考文章:
在 echarts折线图中添加一个自定义的 html元素_Alice_hhu的博客-CSDN博客_echarts添加html元素


 2987
2987


 被折叠的 条评论
为什么被折叠?


