


优化函数Optimizer Algorithm:
梯度下降(Gradient descent,GD)
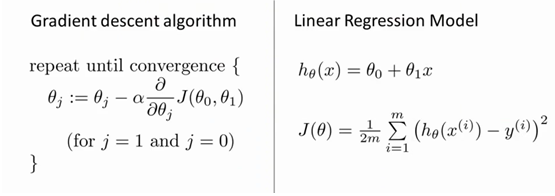
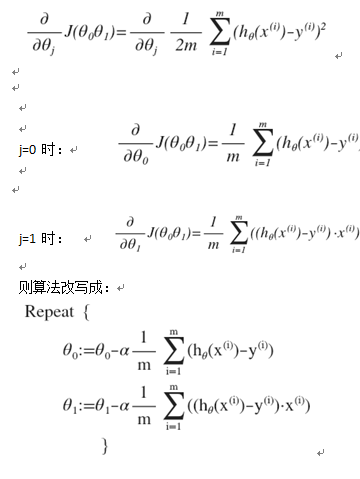
其中 

实现代码(线性预测案例,y=a*x+b,通过最小化loss,优化a,b参数拟合预测曲线):
import matplotlib.pyplot as plt

#预测拟合函数
def h_x(theta0,theta1,x):
	return theta0+theta1*x

def SG(m,lr,theta0,theta1,X,Y):
	sum = 0
	for i in range(0,m):
		sum += (h_x(theta0,theta1,X[i])-Y[i])
	theta0 -= lr/m*sum

	sum = 0
	for i in range(0,m):
		sum += (h_x(theta0,theta1,X[i])-Y[i])*X[i]
	theta1 -= lr/m*sum
	# print("SG: theta0-{} theta1{}".format(theta0,theta1))
	return theta0,theta1

#损失函数
def loss(m,theta0,theta1,X,Y):
	result = 0.0
	for i in range(0,m):
		result += (h_x(theta0,theta1,X[i])-Y[i])**2

	return result/(2*m)

def main():
	#输入输出
	X = [1,2,3,4,5,6]
	Y = [13,14,20,21,25,30]

	m = len(X)

	theta0=0
	theta1=0
	# lr = 0.01
	lr = 0.3

	step = 0
	loss_list = []
	theta0_list = []
	theta1_list = []

	while 1:
		step+=1

		loss0 = 0.0
		loss1 = 0.0

		theta0,theta1 = SG(m,lr,theta0,theta1,X,Y)
		theta0_list.append(theta0)
		theta1_list.append(theta1)

		loss1 = loss(m,theta0,theta1,X,Y)
		loss_list.append(loss1)

		print("theta0:{} theta1:{} loss:{}".format(theta0,theta1,loss1))

		if step>20:
			break

	#输入数据X,Y二维曲线
	ax1 = plt.subplot(2,2,1) #row,col,index
	plt.plot(X,Y,'r') #红色线

	#梯度下降过程随下降次数的损失值二维曲线
	ax2 = plt.subplot(2,2,2)
	plt.plot(list(range(0,step)),loss_list,'g')

	ax3 = plt.subplot(2,2,3)
	plt.plot(list(range(0,step)),theta0_list,c='blue',label="")

	ax4 = plt.subplot(2,2,4)
	plt.plot(theta1_list,loss_list,c='black',label="loss of theta1")
	plt.legend(loc='upper right')

	plt.show()

	print("Finally theta0:{} theta1:{} loss:{}".format(theta0,theta1,loss1))


if __name__ == '__main__':
	main()
lr = 0.01时输出结果:

lr = 0.3时输出结果:

Loss,关于theta0,theta1的梯度下降三维结果图:


 455
455


 被折叠的 条评论
为什么被折叠?
被折叠的 条评论
为什么被折叠?
 到【灌水乐园】发言


