


一、概述
监控是运维的一大利器,要想运维好clickhouse,首先就要对其进行监控,clickhouse有几种监控数据的方式,一种是系统本身监控,一种是通过exporter来监控,下面分别描述一下
二、系统自带监控
我下面会对监控做一些介绍,详细可查看官网
1.配置数据采集
修改配置文件/etc/clickhouse-server/config.xml使其可以往prometheus写数据
<clickhouse>
    <listen_host>0.0.0.0</listen_host>
    <http_port>8123</http_port>
    <tcp_port>9000</tcp_port>
    <prometheus>
        <endpoint>/metrics</endpoint>
        <port>9363</port>
        <metrics>true</metrics>
        <events>true</events>
        <asynchronous_metrics>true</asynchronous_metrics>
    </prometheus>
</clickhouse>
查看metrics数据
curl 127.0.0.1:9363/metrics
2.配置prometheus和grafana
2.1安装prometheus和grafana
prometheus和grafana的启动可查看这个文章
2.2修改prometheus配置文件
# 控制 Prometheus 服务器的全局配置
global:
  scrape_interval: 15s # 将抓取间隔设置为每 15 秒一次。 默认为每 1 分钟一次。
  evaluation_interval: 15s # 每 15 秒评估一次规则。 默认为每 1 分钟一次
  # scrape_timeout 设置为全局默认值(10 秒)。

# 警报配置
alerting:
  alertmanagers:
    - static_configs:
        - targets:
          # - alertmanager:9093

# 规则配置文件
# 加载规则并根据全局 "evaluation_interval" 定期评估
rule_files:
  # - "first_rules.yml"
  # - "second_rules.yml"

# 配置采集目标相关, prometheus 监视的目标。
# Prometheus 自身的运行信息可以通过 HTTP 访问,所以 Prometheus 可以监控自己的运行数据。
scrape_configs:
  # 监控作业的名称
  - job_name: "prometheus"

    # metrics_path defaults to '/metrics'
    # 表示静态目标配置,就是固定从某个 target 拉取数据
    # 默认方案为 HTTP
    static_configs:
      - targets: ["localhost:9090"]

  # 添加如下 clickhouse 监控
  - job_name: "clickhouse"
    static_configs:
      - targets: ['127.0.0.1:9363']
      - targets: ['192.168.1.2:9363']
      - targets: ['192.168.1.3:9363']
2.3 导入grafana模版
导入grafana面板,可以从官网中找合适的面板,亲测如果只使用clickhouse的内部监控,不基于exporter,14192的面板比较合适
- 添加文件夹
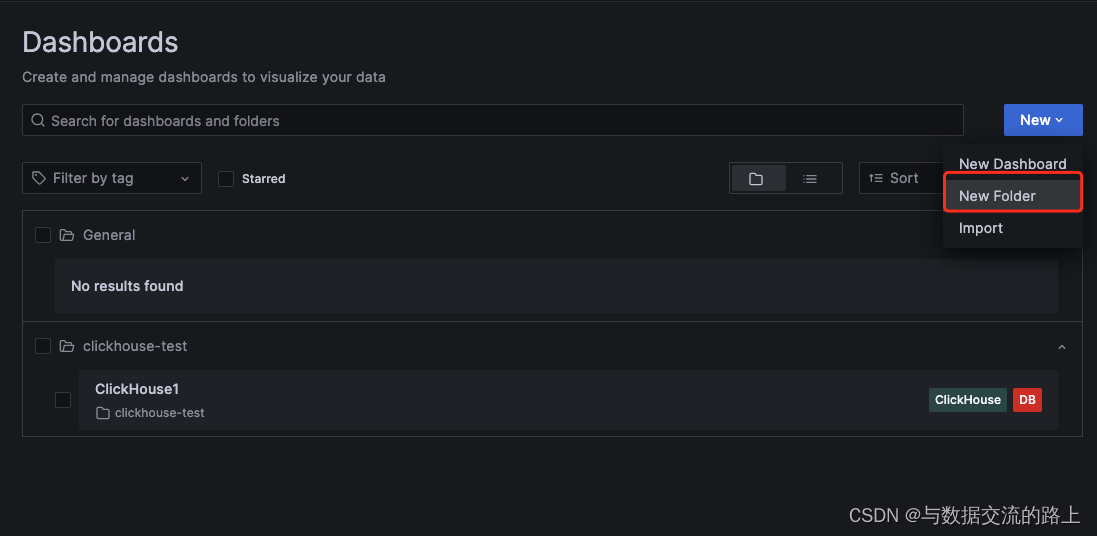
- 添加面板
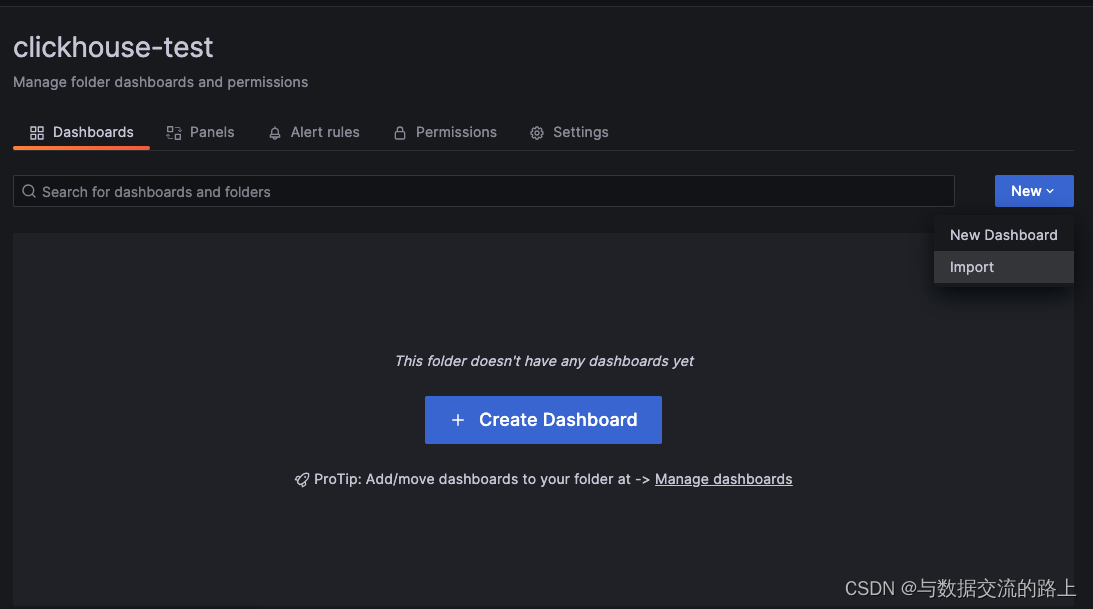
- 选择面板号或直接导入json文件

这样一套基于clickhouse的监控就处理好了
三、基于exporter的监控
clickhouse_exporter详情可以通过github来进行查看,exporter只能用于旧的ClickHouse版本,现代版本嵌入了Prometheus端点,安装go的方式可以看这篇文章
# 安装go环境,使用如下安装方式安装的是go1.6版本,编译会报错,需要安装高版本的go(应该大于1.13版本即可),我使用的是1.21的版本
apt-get install golang

# 下载代码
git clone  https://github.com/ClickHouse/clickhouse_exporter.git
# 进入到目录
cd clickhouse_exporter
# 编译
go build clickhouse_exporter.go
# 启动exporter
nohup ./clickhouse_exporter &
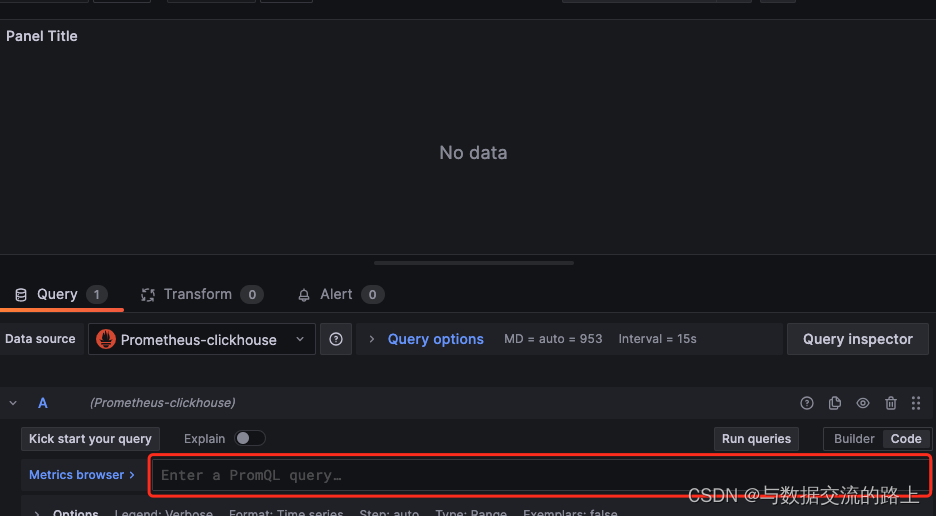
只下来就可以按照上面的步骤来配置了,可以应用882模版,也可以在已有的dashboard中配置一些我们需要的查询

加上对应的query后apply即可
告警指标可以参考腾讯云的指标


 940
940


 被折叠的 条评论
为什么被折叠?
被折叠的 条评论
为什么被折叠?
 到【灌水乐园】发言


