


openTSDB详解之Stats
Stats
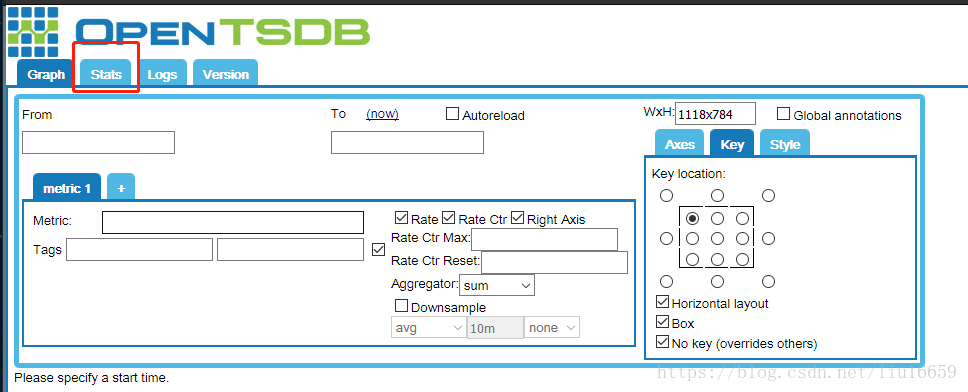
关于openTSDB的性能,openTSDB提供许多metrics,通过各种API端可以访问得到。在GUI中可以通过Stats选项卡【如下图1示】,访问主要的stats,来自于HTTP API /api/stats或者是遗留的API /stats。为了从CLI中拉取数据,Telnet风格的API同样支持“stats”命令。【在你喜欢的任何时间间隔里内】这些都可以轻松地发布到openTSDB中。(原文:These can easily be published right back into OpenTSDB at any interval you like .)
附加的可用stats包括jvm信息,存储信息(例如,每个region-client 的HBase stats)以及可执行的查询细节。详见/api/stats。
所有的metrics来自主要的stats endpoint包括一个host tag,这个host tag包括TSD正在运行的主机名。如果tsd.stats.canonical配置是被设置的,这将改变fqdn并且TSD将会尝试解析它的主机名为了返回全部的限定域名。目前,所有的stats是正数值。对于stats的每个请求将会实时获取statistics,所以timestamp将会反应在TSD主机上的当前时间。
Note
/api/stats endpoint是一个为你的TSD执行一个健康检查的好地方,因为这将执行一个查询去存储获取的UID stats。如果TSD不能到达后端存储,API将会返回一个异常。
【下面这个表格就是openTSDB系统自带的metrics信息】
| Metric | Tags | Type | Description |
|---|---|---|---|
| tsd.connectionmgr.connections | type=open | Gauge | The number of currently open Telnet and HTTP connections. |
| tsd.connectionmgr.connections | type=total | Counter | The total number of connections made to OpenTSDB. This includes all Telnet and HTTP connections. |
| tsd.connectionmgr.exceptions | type=closed | Counter | The total number of exceptions caused by writes to a channel that was already closed. This can occur if a query takes too long, the client closes their connection gracefully, and the TSD attempts to write to the socket. This includes all Telnet and HTTP connections. |
| tsd.connectionmgr.exceptions | type=reset | Counter | The total number of exceptions caused by a client disconnecting without closing the socket. This includes all Telnet and HTTP connections. |
| tsd.connectionmgr.exceptions | type=timeout | Counter | The total exceptions caused by a socket inactivity timeout, i.e. the TSD neither wrote nor received data from a socket within the timeout period. This includes all Telnet and HTTP connections. |
| tsd.connectionmgr.exceptions | type=unknown | Counter | The total exceptions with an unknown cause. Check the logs for details. This includes all Telnet and HTTP connections. |
| tsd.rpc.received | type=telnet | Counter | The total number of telnet RPC requests received |
| tsd.rpc.received | type=http | Counter | The total number of Http RPC requests received |
| tsd.rpc.received | type=http_plugin | Counter | The total number of Http RPC requests received and handled by a plugin instead of the built-in APIs. (v2.2) |
| tsd.rpc.exceptions | Counter | The total number exceptions caught during RPC calls. These may be user error or bugs. | |
| tsd.http.latency_50pct | type=all | Gauge | The time it took, in milliseconds, to answer HTTP requests for the 50th percentile cases |
| tsd.http.latency_75pct | type=all | Gauge | The time it took, in milliseconds, to answer HTTP requests for the 75th percentile cases |
| tsd.http.latency_90pct | type=all | Gauge | The time it took, in milliseconds, to answer HTTP requests for the 90th percentile cases |
| tsd.http.latency_95pct | type=all | Gauge | The time it took, in milliseconds, to answer HTTP requests for the 95th percentile cases |
| tsd.http.latency_50pct | type=graph | Gauge | The time it took, in milliseconds, to answer graphing requests for the 50th percentile cases |
| tsd.http.latency_75pct | type=graph | Gauge | The time it took, in milliseconds, to answer graphing requests for the 75th percentile cases |
| tsd.http.latency_90pct | type=graph | Gauge | The time it took, in milliseconds, to answer graphing requests for the 90th percentile cases |
| tsd.http.latency_95pct | type=graph | Gauge | The time it took, in milliseconds, to answer graphing requests for the 95th percentile cases |
| tsd.http.latency_50pct | type=gnuplot | Gauge | The time it took, in milliseconds, to generate the GnuPlot graphs for the 50th percentile cases |
| tsd.http.latency_75pct | type=gnuplot | Gauge | The time it took, in milliseconds, to generate the GnuPlot graphs for the 75th percentile cases |
| tsd.http.latency_90pct | type=gnuplot | Gauge | The time it took, in milliseconds, to generate the GnuPlot graphs for the 90th percentile cases |
| tsd.http.latency_95pct | type=gnuplot | Gauge | The time it took, in milliseconds, to generate the GnuPlot graphs for the 95th percentile cases |
| tsd.http.graph.requests | cache=disk | Counter | The total number of graph requests satisfied from the disk cache |
| tsd.http.graph.requests | cache=miss | Counter | The total number of graph requests that were not cached and required a fetch from storage |
| tsd.http.query.invalid_requests | Counter | The total number data queries sent to the /api/query endpoint that were invalid due to user errors such as using the wrong HTTP method, missing parameters or using metrics and tags without UIDs. (v2.2) | |
| tsd.http.query.exceptions | Counter | The total number data queries sent to the /api/query endpoint that threw an exception due to bad user input or an underlying error. See logs for details. (v2.2) | |
| tsd.http.query.success | Counter | The total number data queries sent to the /api/query endpoint that completed successfully. Note that these may have returned an empty result. (v2.2) | |
| tsd.rpc.received | type=put | Counter | The total number of put requests for writing data points |
| tsd.rpc.errors | type=hbase_errors | Counter | The total number of RPC errors caused by HBase exceptions |
| tsd.rpc.errors | type=invalid_values | Counter | The total number of RPC errors caused invalid put values from user requests, such as a string instead of a number |
| tsd.rpc.errors | type=illegal_arguments | Counter | The total number of RPC errors caused by bad data from the user |
| tsd.rpc.errors | type=socket_writes_blocked | Counter | The total number of times the TSD was unable to write back to the telnet socket due to a full buffer. If this happens it likely means a number of exceptions were happening. (v2.2) |
| tsd.rpc.errors | type=unknown_metrics | Counter | The total number of RPC errors caused by attempts to put a metric without an assigned UID. This only increments if auto metrics is disabled. |
| tsd.uid.cache-hit | kind=metrics | Counter | The total number of successful cache lookups for metric UIDs |
| tsd.uid.cache-miss | kind=metrics | Counter | The total number of failed cache lookups for metric UIDs that required a call to storage |
| tsd.uid.cache-size | kind=metrics | Gauge | The current number of cached metric UIDs |
| tsd.uid.ids-used | kind=metrics | Counter | The current number of assigned metric UIDs. (NOTE: if random metric UID generation is enabled ids-used will always be 0) |
| tsd.uid.ids-available | kind=metrics | Counter | The current number of available metric UIDs, decrements as UIDs are assigned. (NOTE: if random metric UID generation is enabled ids-used will always be 0) |
| tsd.uid.random-collisions | kind=metrics | Counter | How many times metric UIDs attempted a reassignment due to a collision with an existing UID. (v2.2) |
| tsd.uid.cache-hit | kind=tagk | Counter | The total number of successful cache lookups for tagk UIDs |
| tsd.uid.cache-miss | kind=tagk | Counter | The total number of failed cache lookups for tagk UIDs that required a call to storage |
| tsd.uid.cache-size | kind=tagk | Gauge | The current number of cached tagk UIDs |
| tsd.uid.ids-used | kind=tagk | Counter | The current number of assigned tagk UIDs |
| tsd.uid.ids-available | kind=tagk | Counter | The current number of available tagk UIDs, decrements as UIDs are assigned. |
| tsd.uid.cache-hit | kind=tagv | Counter | The total number of successful cache lookups for tagv UIDs |
| tsd.uid.cache-miss | kind=tagv | Counter | The total number of failed cache lookups for tagv UIDs that required a call to storage |
| tsd.uid.cache-size | kind=tagv | Gauge | The current number of cached tagv UIDs |
| tsd.uid.ids-used | kind=tagv | Counter | The current number of assigned tagv UIDs |
| tsd.uid.ids-available | kind=tagv | Counter | The current number of available tagv UIDs, decrements as UIDs are assigned. |
| tsd.jvm.ramfree | Gauge | The number of bytes reported as free by the JVM’s Runtime.freeMemory() | |
| tsd.jvm.ramused | Gauge | The number of bytes reported as used by the JVM’s Runtime.totalMemory() | |
| tsd.hbase.latency_50pct | method=put | Gauge | The time it took, in milliseconds, to execute a Put call for the 50th percentile cases |
| tsd.hbase.latency_75pct | method=put | Gauge | The time it took, in milliseconds, to execute a Put call for the 75th percentile cases |
| tsd.hbase.latency_90pct | method=put | Gauge | The time it took, in milliseconds, to execute a Put call for the 90th percentile cases |
| tsd.hbase.latency_95pct | method=put | Gauge | The time it took, in milliseconds, to execute a Put call for the 95th percentile cases |
| tsd.hbase.latency_50pct | method=scan | Gauge | The time it took, in milliseconds, to execute a Scan call for the 50th percentile cases |
| tsd.hbase.latency_75pct | method=scan | Gauge | The time it took, in milliseconds, to execute a Scan call for the 75th percentile cases |
| tsd.hbase.latency_90pct | method=scan | Gauge | The time it took, in milliseconds, to execute a Scan call for the 90th percentile cases |
| tsd.hbase.latency_95pct | method=scan | Gauge | The time it took, in milliseconds, to execute a Scan call for the 95th percentile cases |
| tsd.hbase.root_lookups | Counter | The total number of root lookups performed by the client | |
| tsd.hbase.meta_lookups | type=uncontended | Counter | The total number of uncontended meta table lookups performed by the client |
| tsd.hbase.meta_lookups | type=contended | Counter | The total number of contended meta table lookups performed by the client |
| tsd.hbase.rpcs | type=increment | Counter | The total number of Increment requests performed by the client |
| tsd.hbase.rpcs | type=delete | Counter | The total number of Delete requests performed by the client |
| tsd.hbase.rpcs | type=get | Counter | The total number of Get requests performed by the client |
| tsd.hbase.rpcs | type=put | Counter | The total number of Put requests performed by the client |
| tsd.hbase.rpcs | type=rowLock | Counter | The total number of Row Lock requests performed by the client |
| tsd.hbase.rpcs | type=openScanner | Counter | |
| The total number of Open Scanner requests performed by the | |||
| client | |||
| tsd.hbase.rpcs | type=scan | Counter | The total number of Scan requests performed by the client. These indicate a scan->next() call. |
| tsd.hbase.rpcs.batched | Counter | The total number of batched requests sent by the client | |
| tsd.hbase.flushes | Counter | The total number of flushes performed by the client | |
| tsd.hbase.connections.created | Counter | The total number of connections made by the client to region servers | |
| tsd.hbase.nsre | Counter | The total number of No Such Region Exceptions caught. These can happen when a region server crashes, is taken offline or when a region splits (?) | |
| tsd.hbase.nsre.rpcs_delayed | Counter | The total number of calls delayed due to an NSRE that were later successfully executed | |
| tsd.hbase.region_clients.open | Counter | The total number of connections opened to region servers since the TSD started. If this number is climbing the region servers may be crashing and restarting. (v2.2) | |
| tsd.hbase.region_clients.idle_closed | Counter | The total number of connections to region servers that were closed due to idle connections. This indicates nothing was read from or written to a server in some time and the TSD will reconnect when it needs to. (v2.2) | |
| tsd.compaction.count | type=trivial | Counter | The total number of trivial compactions performed by the TSD |
| tsd.compaction.count | type=complex | Counter | The total number of complex compactions performed by the TSD |
| tsd.compaction.duplicates | type=identical | Counter | The total number of data points found during compaction that were duplicates at the same time and with the same value. (v2.2) |
| tsd.compaction.duplicates | type=variant | Counter | The total number of data points found during compaction that were duplicates at the same time but with a different value. (v2.2) |
| tsd.compaction.queue.size | Gauge | How many rows of data are currently in the queue to be compacted. (v2.2) | |
| tsd.compaction.errors | type=read | Counter | The total number of rows that couldn’t be read from storage due to an error of some sort. (v2.2) |
| tsd.compaction.errors | type=put | Counter | The total number of rows that couldn’t be re-written to storage due to an error of some sort. (v2.2) |
| tsd.compaction.errors | type=delete | Counter | The total number of rows that couldn’t have the old non-compacted data deleted from storage due to an error of some sort. (v2.2) |
| tsd.compaction.writes | type=read | Counter | The total number of writes back to storage of compacted values. (v2.2) |
| tsd.compaction.deletes | type=read | Counter | The total number of delete calls made to storage to remove old data that has been compacted. (v2.2) |


 8176
8176

 被折叠的 条评论
为什么被折叠?
被折叠的 条评论
为什么被折叠?
 到【灌水乐园】发言


