


以下的内容,希望你的环节是在8.011 以上的环境中操作,部分需要在8.018 以上环境操作
MYSQL 如果你在使用MYSQL 8 的版本,那么performance schema 的确的重新认识一下了。在重新认识 mysql的 performance_schema之前我们有一些需要在强化的知识。分别是 threads , instruments , consumers , events, digests, dynamic configuration
为什么要明白这些东西,MYSQL 之前的一些性能的分析和评估都是基于“”原始模式“ ,如show engine innodb status; 获取关键的数据库信息
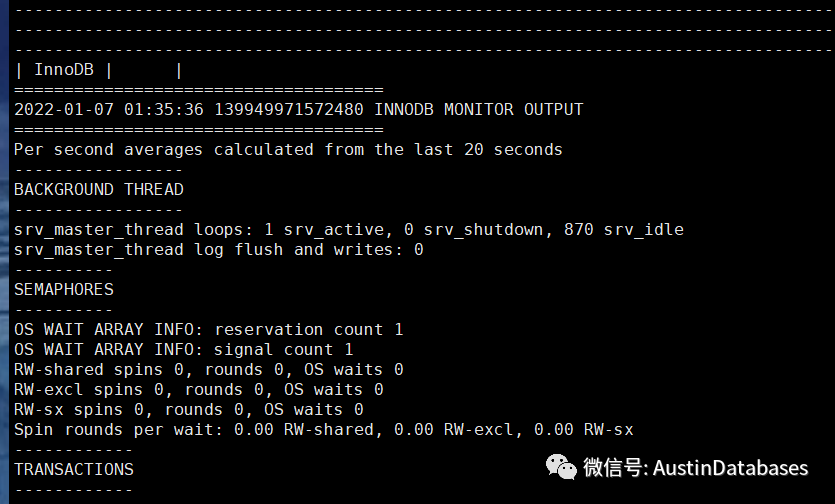
基于MYSQL 8 很多年了, 这样获取性能的模式要改变了,那么通过performance_schema 来获取整体MYSQL的性能是必须要做的功课了。
下面针对上面的一些东西做了如下的解释
1 threads ,这个线程的概念在performance_schema 中是一个关键的体现,任何工作在MYSQL 中均以线程为中心,在MYSQL后端中都是基于线程进行的工作。无论是连接,还是内部的并行工作中都是以线程为主。
当然基于MYSQL 8 ,并行的方式读取数据已经成为可能,那么这里有一个概念可能会有点混淆,就是一个SQL 可能有多个线程在工作,但这并不能影响线程,单线程对于MYSQL的意义。
在工作中,针对各种访问,thread_id 是跟踪访问的一种方式,所以performace_schema 中必然有thread_id的一个位置。
SELECT THREAD_ID AS TID, SUBSTRING_INDEX(NAME, '/', -2) AS THREAD_NAME, IF(TYPE = 'BACKGROUND', '*', ") AS B, IFNULL(PROCESSLIST_ID, ") AS PID FROM performance_schema.threads;
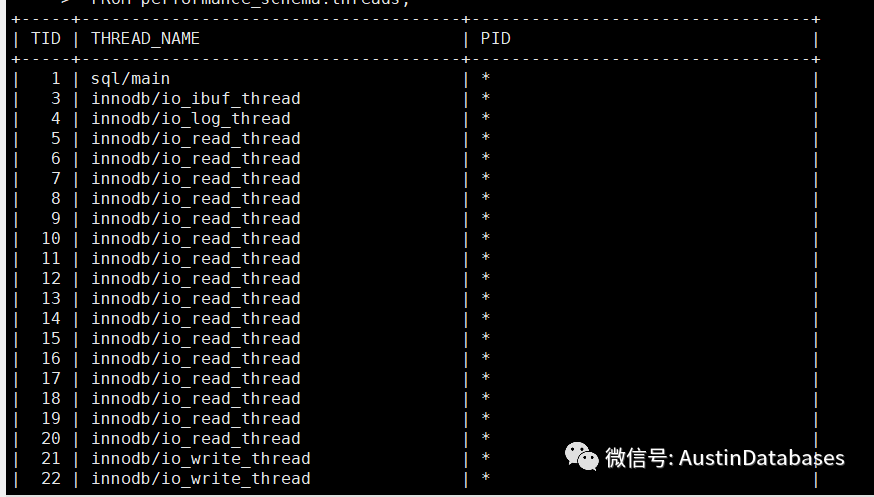
通过上面的语句,可以对MYSQL 的后台线程,以及后台的功能有一个初步的认知。
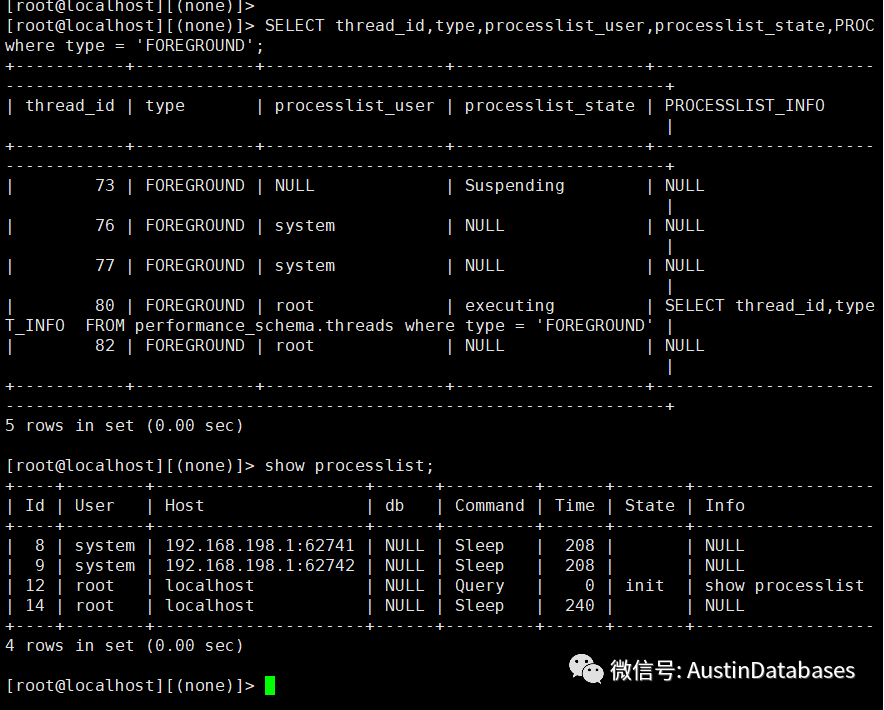
这里可能会有一个问题,那我以后是用 show processlist 来看执行的前端的工作线程,还是
SELECT thread_id,type,processlist_user,processlist_state,PROCESSLIST_INFO FROM performance_schema.threads where type = 'FOREGROUND'
通过 performance_schema.threads 来查看。
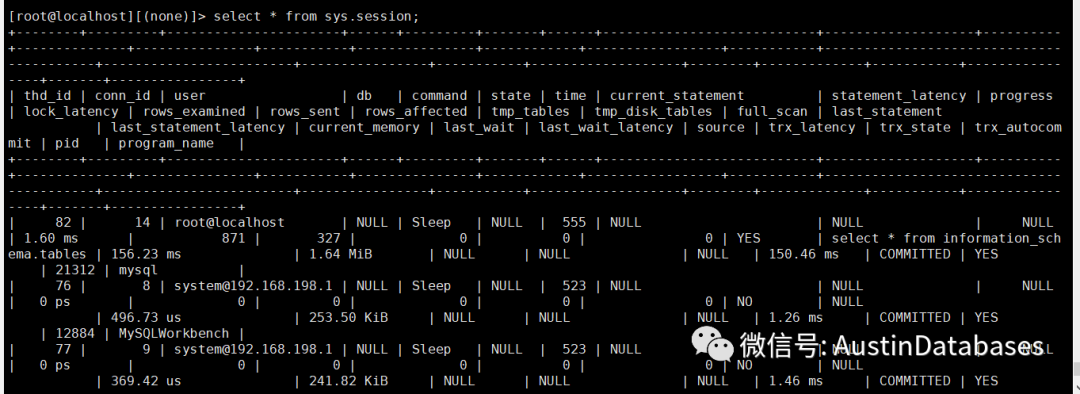
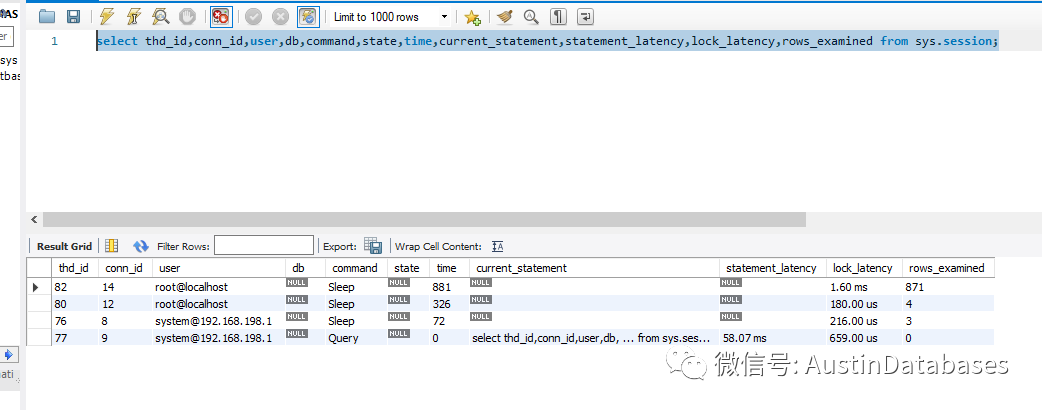
select * from sys.session;
这样的查询方式会获得更多的信息,以及占用更好的资源。
select thd_id,conn_id,user,db,command,state,time,current_statement,statement_latency,lock_latency,rows_examined from sys.session;
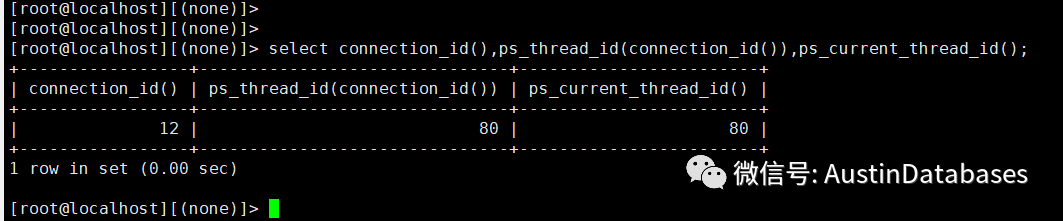
那么在session连接的ID 与 thread_id 之间的对应关系就需要通过函数ps_thread_id()来解决。
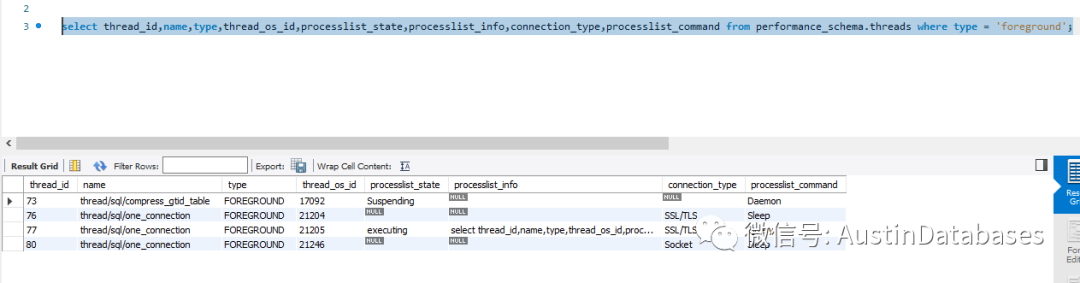
select thread_id,name,type,thread_os_id,processlist_state,processlist_info,connection_type,processlist_command from performance_schema.threads where type = 'foreground';
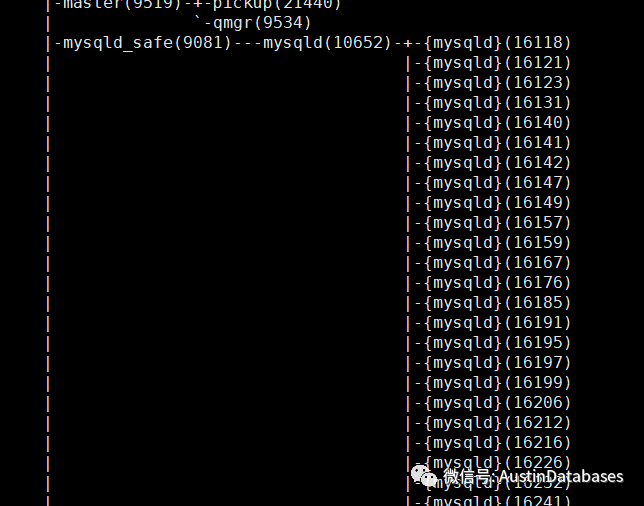
通过上面的语句可以找到 mysql 进程中的线程中的子线程的分配情况
在大概了解了上面在MYSQL 中的 thread 的查询后,后面针对MYSQL 8 的数据库性能性能查询方式就可以改变了,通过 performance_schema 中的thread 也不失为一个好办法。
Instruments 在performance中可以作为承载信息的类型,其中包含 error , idle , memory , stage , statement, transactio, wait 在这些类型中,可以根据时间来划分类型,memory ,statement , wait 是instruments 中重点的三项, 包含了数据库中内存的使用项目, 语句的使用项目,以及系统运行中的等待项目。
但需要注意的是,如果想针对系统性能有优化的情况下,可以针对这些信息进行更详细的收集而不是都打开,都打开的情况下 会收集 1200 - 1300左右的信息,对系统的影响比较大。
那么怎么针对这些信息进行分类
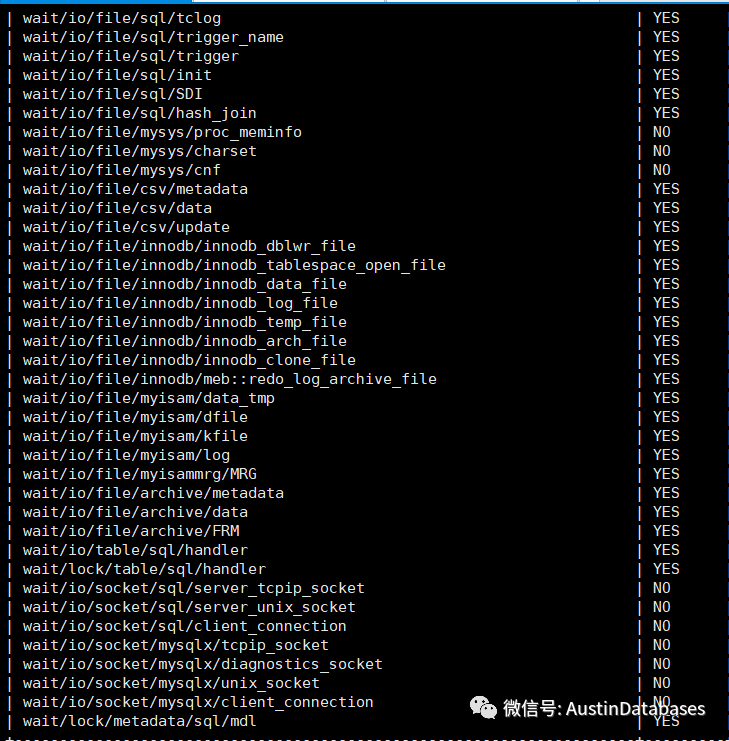
select name,enabled from setup_instruments where name like 'wait%';
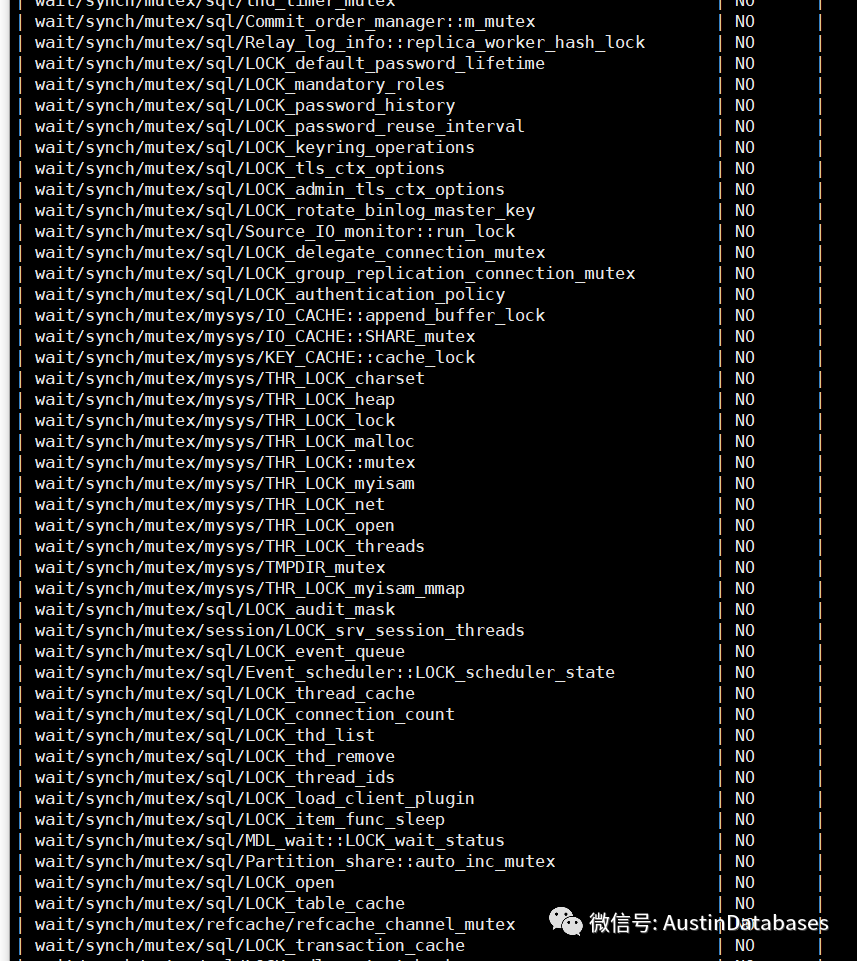
举例我们需要针对 instrument 的 wait 进行详细的配置,
performance-schema-instrument = "wait/synch/%=OFF"
performance-schema-instrument = "wait/io/file/%=COUNTED"
performance-schema-instrument = "wait/lock/table/sql/handler=ON"
performance-schema-instrument = "wait/io/file/mysys/%=OFF"
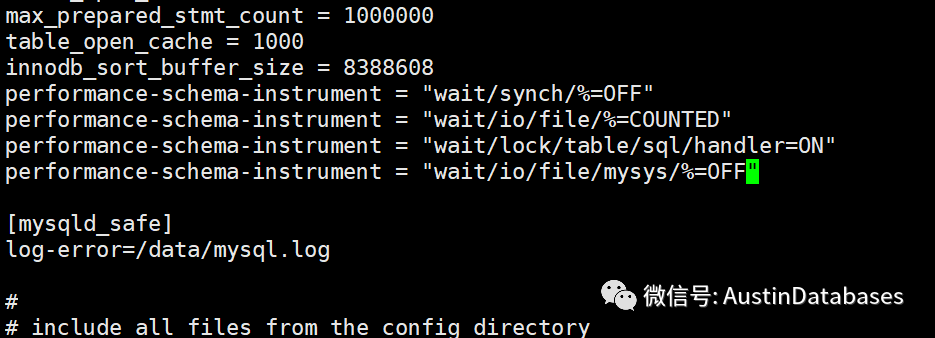
配置后,重启服务器,一些配置中不需要统计的信息就不在被容器记录了。
下面是目前对instrument 中信息的收集的配置,将这些配置配置到【MYSQLD】下
performance-schema-instrument = "wait/synch/%=OFF"
performance-schema-instrument = "wait/io/file/%=COUNTED"
performance-schema-instrument = "wait/lock/table/sql/handler=ON"
performance-schema-instrument = "wait/io/file/mysys/%=OFF"
performance-schema-instrument = "error/%=OFF"
performance-schema-instrument = "transaction/%=OFF"
performance-schema-instrument = "stage/%=OFF"
performance-schema-instrument = "memory/myisam/%=OFF"
performance-schema-instrument = "memory/memory/%=OFF"
performance-schema-instrument = "memory/innodb/%=OFF"
performance-schema-instrument = "memory/innodb/ibuf0ibuf=ON"
performance-schema-instrument = "stage/sql/Waiting%=ON"
performance-schema-instrument = "statement/sp/%=OFF"


 635
635


 被折叠的 条评论
为什么被折叠?
被折叠的 条评论
为什么被折叠?
 到【灌水乐园】发言


