


序言
Prometheus是tsdb进行存储,部署在Kubernetes要注意数据持久化,有rule,config文件常规化变更,需要热加载,需要注意ConfigMap资源。
配置文件ConfigMap
保证配置常规化更新,支持热加载,将Prometheus yaml配置文件打包成ConfigMap进行管理。
master操作
#kubectl create ns prometheus
master操作
#cat > prometheus_cm.yaml << EOF
apiVersion: v1
kind: ConfigMap
metadata:
  name: prometheus-config
  namespace: prometheus
data:
  prometheus.yml: |
    global:
      scrape_interval: 15s
      scrape_timeout: 15s
    scrape_configs:
    - job_name: 'prometheus'
      static_configs:
      - targets: ['localhost:9090']
EOF
#kubectl apply -f prometheus_cm.yaml
数据持久化pv/pvc
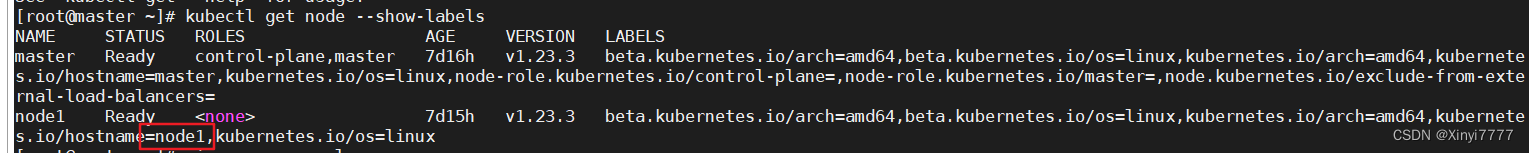
本地利用StorageClass,生成pv资源,设定标签为Prometheus,local确定挂载path,kubernetes.io/hostname values设定亲和性,values的值为node的标签,master操作如下可以获取到标签值。不设定执行下面的yaml会报错。

#kubectl get nodes --show-labels
亲和性节点操作
#mkdir /data/k8s/prometheus -p
master操作
#cat > prometheus_pvc.yaml << EOF
apiVersion: v1
kind: PersistentVolume
metadata:
  name: prometheus-pv
  labels:
    app: prometheus
spec:
  accessModes:
  - ReadWriteOnce
  capacity:
    storage: 10Gi
  storageClassName: my-storage
  local:
    path: /data/k8s/prometheus
  nodeAffinity:
    required:
      nodeSelectorTerms:
      - matchExpressions:
        - key: kubernetes.io/hostname
          operator: In
          values:
          - node1
  persistentVolumeReclaimPolicy: Retain
---
apiVersion: v1
kind: PersistentVolumeClaim
metadata:
  name: prometheus-pvc
  namespace: prometheus
spec:
  selector:
    matchLabels:
      app: prometheus
  accessModes:
  - ReadWriteOnce
  resources:
    requests:
      storage: 10Gi
  storageClassName: my-storage
EOF
#kubectl apply -f prometheus_pvc.yaml
RBAC权限
为Prometheus生成一个集群内部权限,可能会出现apiserver版本错误
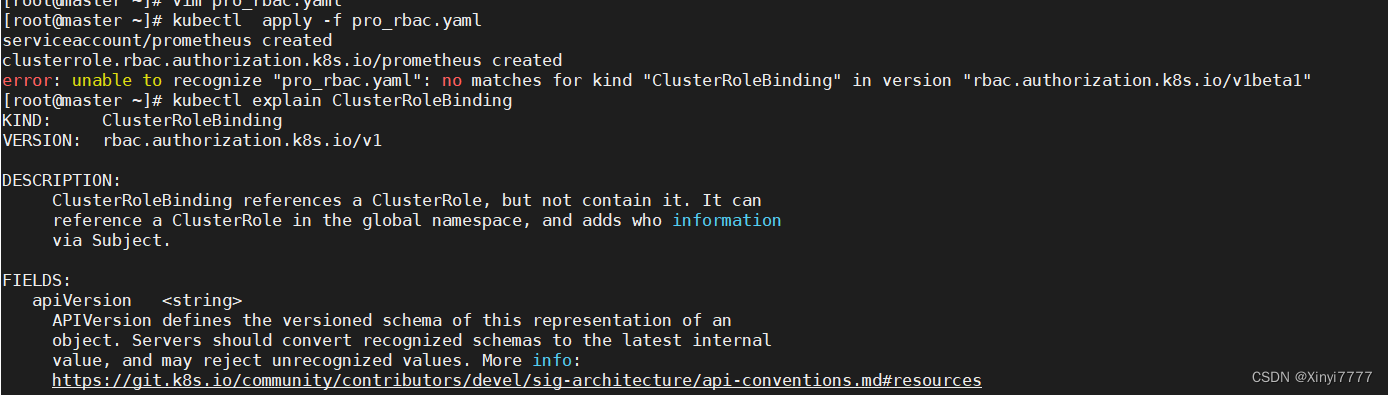
#kubectl explain ClusterRoleBinding.apiVersion
#cat > prometheus_rbac.yaml << EOF
apiVersion: v1
kind: ServiceAccount
metadata:
  name: prometheus
  namespace: prometheus
---
apiVersion: rbac.authorization.k8s.io/v1
kind: ClusterRole
metadata:
  name: prometheus
rules:
- apiGroups:
  - ""
  resources:
  - nodes
  - services
  - endpoints
  - pods
  - nodes/proxy
  verbs:
  - get
  - list
  - watch
- apiGroups:
  - "extensions"
  resources:
    - ingresses
  verbs:
  - get
  - list
  - watch
- apiGroups:
  - ""
  resources:
  - configmaps
  - nodes/metrics
  verbs:
  - get
- nonResourceURLs:
  - /metrics
  verbs:
  - get
---
apiVersion: rbac.authorization.k8s.io/v1
kind: ClusterRoleBinding
metadata:
  name: prometheus
roleRef:
  apiGroup: rbac.authorization.k8s.io
  kind: ClusterRole
  name: prometheus
subjects:
- kind: ServiceAccount
  name: prometheus
  namespace: prometheus
EOF
#kubectl apply -f prometheus_rbac.yaml
Prometheus服务部署
将ConfigMap资源进行挂载,加上前面生成的ServiceAccount资源,以Deployment类型进行pod管理。
#cat > prometheus_deploy.yaml << EOF
apiVersion: apps/v1
kind: Deployment
metadata:
  name: prometheus
  namespace: prometheus
  labels:
    app: prometheus
spec:
  selector:
    matchLabels:
      app: prometheus
  template:
    metadata:
      labels:
        app: prometheus
    spec:
      securityContext:
        runAsUser: 0
      serviceAccountName: prometheus
      containers:
      - image: prom/prometheus:v2.30.2
        name: prometheus
        args:
        - "--config.file=/etc/prometheus/prometheus.yml"
        - "--storage.tsdb.path=/prometheus"
        - "--storage.tsdb.retention.time=24h"
        - "--web.enable-admin-api"
        - "--web.enable-lifecycle"
        ports:
        - containerPort: 9090
          name: http
        volumeMounts:
        - mountPath: "/etc/prometheus"
          name: config-volume
        - mountPath: "/prometheus"
          name: data
        resources:
          requests:
            cpu: 100m
            memory: 512Mi
          limits:
            cpu: 100m
            memory: 512Mi
      volumes:
      - name: data
        persistentVolumeClaim:
          claimName: prometheus-svc
      - name: config-volume
        configMap:
          name: prometheus-config
EOF
#kubectl apply -f prometheus_deploy.yaml
服务暴露访问
以NodePort的service类型暴露服务在宿主机上,可以直接进行外部访问。
#cat > prometheus_svc.yaml << EOF
apiVersion: v1
kind: Service
metadata:
  name: prometheus
  namespace: prometheus
  labels:
    app: prometheus
spec:
  selector:
    app: prometheus
  type: NodePort
  ports:
    - name: web
      port: 9090
      targetPort: http
EOF
#kubectl apply -f prometheus_svc.yaml
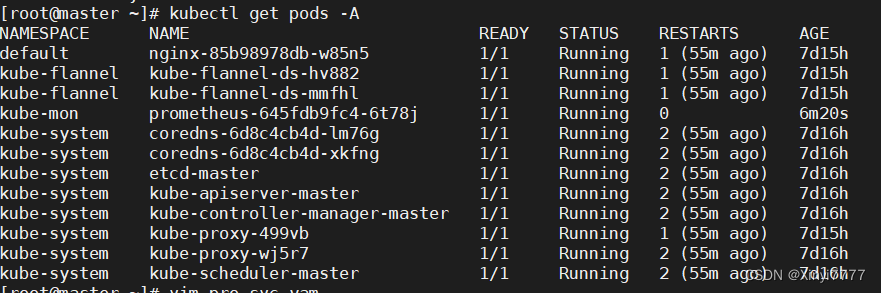
查看集群状态、服务状态和service
#kubectl get pods -A
#kubectl get svc-A
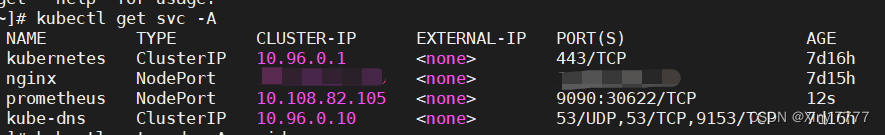
查询到暴露在外部的端口是30622,可以页面直接masterip:30622访问


 2157
2157


 被折叠的 条评论
为什么被折叠?
被折叠的 条评论
为什么被折叠?
 到【灌水乐园】发言


