


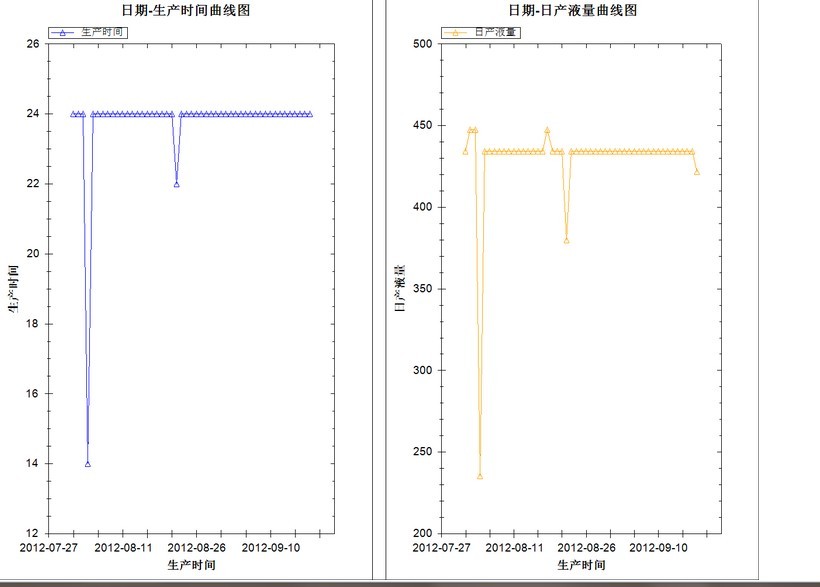
效果:
首先下载ZedGraph控件,注册然后添加引用,再添加到aspx页面中:
<%@ Register Assembly="ZedGraph.Web" Namespace="ZedGraph.Web" TagPrefix="cc1" %>
<cc1:ZedGraphWeb ID="ZedGraphWeb1" runat="server"
onrendergraph="ZedGraphWeb1_RenderGraph" RenderMode="RawImage"
Height="1000" Width="1300">
</cc1:ZedGraphWeb>
几个概念:MasterPane 相当于一个大的绘图区域,GraphPane 相当于具体的绘图区域,PointPairList 为坐标对集合,就是曲线上的一个个点,LineItem 为曲线
代码实现:
添加命名空间:
using ZedGraph;
using ZedGraph.Web;
using System.Data;
using System.Drawing;
//程序加载的时候会触发这个函数:
protected void ZedGraphWeb1_RenderGraph(ZedGraph.Web.ZedGraphWeb webObject, System.Drawing.Graphics g, ZedGraph.MasterPane pane)
{
pane.PaneList.Clear();pane.PaneList.Clear();
for (int j = 0; j < n; j++) //n为曲线条数
{
// Title
GraphPane myPane = new GraphPane(new Rectangle(40, 40, 500, 250), "Case #", "", "");
//曲线标题
myPane.Title.Text = "日期-"+Application[Convert.ToString(j)]+"曲线图";
// X,Y轴标题
myPane.XAxis.Title.Text = "生产时间";
myPane.YAxis.Title.Text = Application[Convert.ToString(j)].ToString();
//是否设置网格线
if (Application["GridLine"] == "1")
{
myPane.XAxis.MajorGrid.IsVisible = true;
myPane.XAxis.MinorGrid.IsVisible = true;
myPane.YAxis.MinorGrid.IsVisible = true;
myPane.YAxis.MajorGrid.IsVisible = true;
}
else
{
myPane.XAxis.MajorGrid.IsVisible = false;
myPane.XAxis.MinorGrid.IsVisible = false;
myPane.YAxis.MinorGrid.IsVisible = false;
myPane.YAxis.MajorGrid.IsVisible = false;
}
//设置小步长和大步长
myPane.XAxis.Scale.MajorStep = Convert.ToDouble(Application["pointInter"].ToString());
myPane.XAxis.Scale.MinorStep = Convert.ToDouble(Application["pointInter"].ToString());
//
myPane.XAxis.Type = ZedGraph.AxisType.DateAsOrdinal;
//ZedGraph有专门的时间类型
// XDate x1 = new XDate();
// 坐标对集合
PointPairList line = new PointPairList();
// 取数据部分
DataBase dbLink = new DataBase("chunliang");
if (Application["type"] == "水井")
{
dbLink.SQLExcByAdapter("Select rq," + Application[Convert.ToString(j) + "flag"].ToString() + " from ys_dba02 where jh='" + Application["jh"].ToString() + "' and rq<to_date('" + Application["jsrq"] + "','yyyy-MM-dd') and rq>to_date('" + Application["ksrq"] + "','yyyy-MM-dd') order by rq");
}
else
dbLink.SQLExcByAdapter("Select rq," + Application[Convert.ToString(j) + "flag"].ToString() + " from ys_dba01 where jh='" + Application["jh"].ToString() + "' and rq<to_date('" + Application["jsrq"] + "','yyyy-MM-dd') and rq>to_date('" + Application["ksrq"] + "','yyyy-MM-dd') order by rq");
DataTable dt = dbLink.dateSet.Tables[0];
//将X轴设置成时间类型
myPane.XAxis.Type = AxisType.Date;
// 将数据转为(X,Y)坐标对
for (int i = 0; i < dt.Rows.Count; i++)
{
string date = Convert.ToDateTime(dt.Rows[i]["rq"]).ToString("yyyyMMdd");
double x = (double)new XDate(Convert.ToInt16(date.Substring(0, 4)), Convert.ToInt16(date.Substring(4, 2)), Convert.ToInt16(date.Substring(6, 2)));
if (dt.Rows[i][Application[Convert.ToString(j) + "flag"].ToString()].ToString() != "")
{
//添加数据点
line.Add(x, Convert.ToDouble(dt.Rows[i][Application[Convert.ToString(j) + "flag"].ToString()]));
}
}
//X轴时间显示方式
myPane.XAxis.Scale.Format = "yyyy-MM-dd";
// myPane.BaseDimension = (float)Convert.ToDouble(Application["XYWidth"]);
myPane.BaseDimension = 10;
// 绘制曲线
LineItem li = myPane.AddCurve(Application[Convert.ToString(j)].ToString(), line, Color.FromName(“Red"].ToString()), SymbolType.Triangle);
//曲线宽度
li.Line.Width = (float)Convert.ToDouble(Application["width"].ToString());
pane.Add(myPane);
pane.AxisChange(g);
}


 2024
2024


 被折叠的 条评论
为什么被折叠?
被折叠的 条评论
为什么被折叠?
 到【灌水乐园】发言


