


<div class="count-wrap">
            <canvas id="time-graph-canvas" width="160" height="160"></canvas>
          </div>
.count-wrap {
width: 3rem;
height: 3rem;
position: relative;
#time-graph-canvas {
width: 3rem;
height: 3rem;
position: absolute;
top: 0;
}
}methods: {
drawMain (drawingElem, bgcolor, percent1, color1, percent2, color2, percent3, color3) {
color1 = percent1 === 0 ? '#eee' : color1
color2 = percent2 === 0 ? '#eee' : color2
color3 = percent3 === 0 ? '#eee' : color3
var context = drawingElem.getContext('2d')
var centerX = drawingElem.width / 2
var centerY = drawingElem.height / 2
var rad = Math.PI * 2 / 100
const rad1 = -Math.PI / 2 + percent1 * rad
const rad2 = -Math.PI / 2 + (percent1 + percent2) * rad
const rad3 = -Math.PI / 2 + (percent1 + percent2 + percent3) * rad
function backgroundCircle () {
context.save()
context.beginPath()
context.lineWidth = 20
var radius = centerX - context.lineWidth
context.lineCap = 'round'
context.strokeStyle = bgcolor
context.arc(centerX, centerY, radius, 0, Math.PI * 2, false)
context.stroke()
context.closePath()
context.restore()
}
function foregroundCircle (start, end, color) {
context.save()
context.strokeStyle = color
if (color === '#eee') {
context.lineWidth = 0
} else {
context.lineWidth = 20
}
context.lineCap = 'round'
var radius = centerX - context.lineWidth
context.beginPath()
context.arc(centerX, centerY, radius, start, end, false)
context.stroke()
context.closePath()
context.restore()
}
backgroundCircle()
foregroundCircle(-Math.PI / 2, rad1, color1)
foregroundCircle(rad1, rad2, color2)
foregroundCircle(rad2, rad3, color3)
}
},
mounted() {
var timeCanvas = document.getElementById('time-graph-canvas')
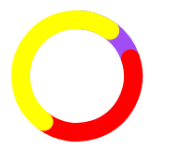
this.drawMain(timeCanvas, '#eee', 20, '#A24CF5', 40, 'red', 50, 'yellow')
},效果如下:


 2487
2487


 被折叠的 条评论
为什么被折叠?
被折叠的 条评论
为什么被折叠?
 到【灌水乐园】发言


