


在 Gin 框架中集成 Prometheus 监控系统,可以帮助开发者实时收集和展示应用程序的性能指标,便于监控和故障排查。
Prometheus 是一个开源的监控和告警系统,最初由 SoundCloud 开发,现已成为 Cloud Native Computing Foundation (CNCF) 的毕业项目(最高成熟度级别)。它专为动态云原生环境设计,能够高效地收集、存储和查询时间序列数据(即带有时间戳的指标数据),广泛应用于 Kubernetes、微服务架构和分布式系统的监控。
以下是集成步骤和关键代码示例:
1. 添加依赖
首先,需要在项目中添加 Prometheus 的 Go 客户端库:
go get github.com/prometheus/client_golang/prometheus
go get github.com/prometheus/client_golang/prometheus/promhttp
2. 定义监控指标
使用 Prometheus 提供的指标类型(如 Counter、Gauge、Histogram 等)定义需要监控的指标。例如:
import (
    "github.com/prometheus/client_golang/prometheus"
    "github.com/prometheus/client_golang/prometheus/promauto"
)

var (
    // 监控 HTTP 请求总数
    httpRequestsTotal = promauto.NewCounterVec(
        prometheus.CounterOpts{
            Name: "http_requests_total",
            Help: "Total number of HTTP requests",
        },
        []string{"method", "path", "status"},
    )

    // 监控 HTTP 请求处理时间
    httpRequestDuration = promauto.NewHistogramVec(
        prometheus.HistogramOpts{
            Name:    "http_request_duration_seconds",
            Help:    "Histogram of HTTP request durations",
            Buckets: []float64{0.1, 0.3, 0.5, 0.7, 1, 2, 5},
        },
        []string{"method", "path"},
    )
)
3. 创建 Prometheus 中间件
编写一个 Gin 中间件,用于记录每个请求的指标:
func PrometheusMiddleware() gin.HandlerFunc {
    return func(c *gin.Context) {
        start := time.Now()
        path := c.Request.URL.Path
        method := c.Request.Method

        c.Next() // 继续处理请求

        // 记录请求处理时间
        duration := time.Since(start).Seconds()
        status := c.Writer.Status()

        httpRequestsTotal.WithLabelValues(method, path, strconv.Itoa(status)).Inc()
        httpRequestDuration.WithLabelValues(method, path).Observe(duration)
    }
}
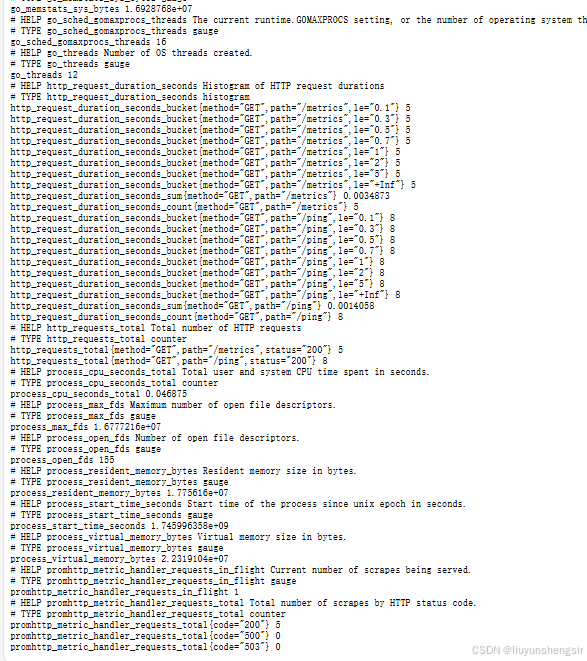
4. 暴露监控指标
在 Gin 路由中添加一个 /metrics 端点,用于暴露 Prometheus 格式的监控指标:
func main() {
    r := gin.Default()

    // 使用 Prometheus 中间件
    r.Use(PrometheusMiddleware())

    // 暴露监控指标
    r.GET("/metrics", gin.WrapH(promhttp.Handler()))

    // 示例路由
    r.GET("/ping", func(c *gin.Context) {
        c.JSON(200, gin.H{
            "message": "pong",
        })
    })

    // 启动服务
    r.Run(":8080")
}
5. 配置 Prometheus 抓取指标
在 Prometheus 的配置文件(prometheus.yml)中添加抓取任务:
scrape_configs:
  - job_name: "gin_app"
    static_configs:
      - targets: ["localhost:8080"]
6. 可视化监控数据
使用 Grafana 等工具将 Prometheus 收集的指标进行可视化展示。以下是几个常用的监控面板:
- 请求总数:
http_requests_total - 请求处理时间:
http_request_duration_seconds - 错误率:
rate(http_requests_total{status=~"5.."}[5m]) / rate(http_requests_total[5m])
7. 高级配置(可选)
- 自定义指标:根据业务需求添加自定义指标,如数据库查询时间、缓存命中率等。
- Pushgateway:对于短暂运行的任务,可以使用 Pushgateway 将指标推送到 Prometheus。
- 告警规则:在 Prometheus 中配置告警规则,当指标超过阈值时触发告警。
总结
通过以上步骤,你可以在 Gin 框架中轻松集成 Prometheus 监控系统,实现对应用程序性能的实时监控和可视化分析。这不仅有助于及时发现和解决问题,还能为系统优化提供数据支持。
全部代码文件
package main

import (
	"strconv"
	"time"

	"github.com/gin-gonic/gin"
	"github.com/prometheus/client_golang/prometheus"
	"github.com/prometheus/client_golang/prometheus/promhttp"
)

var (
	// 定义监控指标
	httpRequestsTotal = prometheus.NewCounterVec(
		prometheus.CounterOpts{
			Name: "http_requests_total",
			Help: "Total number of HTTP requests",
		},
		[]string{"method", "path", "status"},
	)

	httpRequestDuration = prometheus.NewHistogramVec(
		prometheus.HistogramOpts{
			Name:    "http_request_duration_seconds",
			Help:    "Histogram of HTTP request durations",
			Buckets: []float64{0.1, 0.3, 0.5, 0.7, 1, 2, 5},
		},
		[]string{"method", "path"},
	)
)

func init() {
	// 注册监控指标
	prometheus.MustRegister(httpRequestsTotal)
	prometheus.MustRegister(httpRequestDuration)
}

// PrometheusMiddleware 中间件,用于记录请求指标
func PrometheusMiddleware() gin.HandlerFunc {
	return func(c *gin.Context) {
		start := time.Now()
		path := c.Request.URL.Path
		method := c.Request.Method

		c.Next() // 继续处理请求

		// 记录请求处理时间和状态码
		duration := time.Since(start).Seconds()
		status := c.Writer.Status()

		httpRequestsTotal.WithLabelValues(method, path, strconv.Itoa(status)).Inc()
		httpRequestDuration.WithLabelValues(method, path).Observe(duration)
	}
}

func main() {
	r := gin.Default()

	// 使用 Prometheus 中间件
	r.Use(PrometheusMiddleware())

	// 暴露监控指标端点
	r.GET("/metrics", gin.WrapH(promhttp.Handler()))

	// 示例路由
	r.GET("/ping", func(c *gin.Context) {
		c.JSON(200, gin.H{
			"message": "pong",
		})
	})

	// 启动服务
	r.Run(":8080")
}


 4904
4904

 被折叠的 条评论
为什么被折叠?
被折叠的 条评论
为什么被折叠?
 到【灌水乐园】发言


