


原生的matplotlib并不支持直接使用中文,而需要修改一下相应的文件,上网搜了下,找到一个最简洁的办法。
NO.1
找到matplotlibrc文件
C:\Python26\Lib\site-packages\matplotlib\mpl-data\matplotlibrc(Windows)
/usr/share/matplotlib/mpl-data/matplotlibrc (Linux)
NO.2
找到以下两项,去掉#
font.family : sans-serif
font.sans-serif : Microsoft YaHei , Bitstream Vera Sans, Lucida Grande, Verdana, Geneva, Lucid, Arial, Helvetica, Avant Garde, sans-serif #添加“Microsoft YaHei”,该行指示缺省字体
NO.3
在写code的时候记得在字符串前加上u,表示unicode编码,例如:
setupGraph(
title=”Speed of Train “,
xlabel=u’Time 单位:s’,
ylabel=u”Speed 单位:m/s”,
hold=True
)
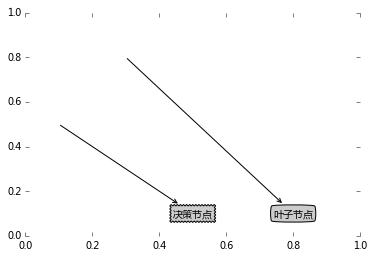
例如如下代码绘制中文节点:
import matplotlib.pyplot as plt
#定义决策节点和叶子节点的风格
decisionNode = dict(boxstyle = "sawtooth",fc="0.8")
#boxstyle = "swatooth"意思是注解框的边缘是波浪线型的,fc控制的注解框内的颜色深度
leafNode = dict(boxstyle="round4",fc="0.8")
arrow_args = dict(arrowstyle="<-")#箭头符号
"""
@brief 绘制节点
@param[in] nodeTxt 节点显示文本
@param[in] centerPt 起点位置
@param[in] parentPt 终点位置
@param[in] nodeType 节点风格
"""
def plotNode(nodeTxt,centerPt,parentPt,nodeType):
    createPlot.ax1.annotate(nodeTxt,xy=parentPt,xycoords='axes fraction',\
    xytext=centerPt,textcoords='axes fraction',\
    va="center",ha="center",bbox=nodeType,arrowprops=arrow_args)
def createPlot():
    fig=plt.figure(1,facecolor='white')
    fig.clf()
    createPlot.ax1 = plt.subplot(111,frameon=False) #绘制子图
    plotNode(U'决策节点',(0.5,0.1),(0.1,0.5),decisionNode)
    plotNode(U'叶子节点',(0.8,0.1),(0.3,0.8),leafNode)
    plt.show()
结果:


 987
987

 被折叠的 条评论
为什么被折叠?
被折叠的 条评论
为什么被折叠?
 到【灌水乐园】发言


