


#Supervised Machine Learning Regression and Classification/Week1/Regression Medel/C1_W1_Lab04_Cost_function_Soln.ipynb
注意:官方运行环境:py3.7
本文运行环境:py3.8
其他版本的py可以作为一个参考
1、需要的Package
numpy
matplotlib
(注意:在Jupyter Notebook的Terminal中使用command进行matplotlib的下载会得到一个名叫matplotlib-inline的Package,这个包与matplotlib的区别可以参考这篇文章,在Anaconda Prompt中使用 pip install matplotlib可以的到matplotlib库)
2、动态图片无法显示的问题
在吴老师的代码中有这么一段:
%matplotlib widget此处使用的是一个魔法函数,详情参考文章。
这段在使用的时候会产生一个报错:
(这是只用matplotlib-inline库的报错,之后的代码也无法运行,所以事前下载库的时候留意下的是matplotlib)
ImportError                               Traceback (most recent call last)
Cell In[3], line 2
      1 import numpy as np
----> 2 get_ipython().run_line_magic('matplotlib', 'widget')
      3 import matplotlib.pyplot as plt
      4 from lab_utils_uni import plt_intuition, plt_stationary, plt_update_onclick, soup_bowl

File D:\Environment\ANACONDA\envs\Torch\lib\site-packages\IPython\core\interactiveshell.py:2417, in InteractiveShell.run_line_magic(self, magic_name, line, _stack_depth)
   2415     kwargs['local_ns'] = self.get_local_scope(stack_depth)
   2416 with self.builtin_trap:
-> 2417     result = fn(*args, **kwargs)
   2419 # The code below prevents the output from being displayed
   2420 # when using magics with decodator @output_can_be_silenced
   2421 # when the last Python token in the expression is a ';'.
   2422 if getattr(fn, magic.MAGIC_OUTPUT_CAN_BE_SILENCED, False):

File D:\Environment\ANACONDA\envs\Torch\lib\site-packages\IPython\core\magics\pylab.py:99, in PylabMagics.matplotlib(self, line)
     97     print("Available matplotlib backends: %s" % backends_list)
     98 else:
---> 99     gui, backend = self.shell.enable_matplotlib(args.gui.lower() if isinstance(args.gui, str) else args.gui)
    100     self._show_matplotlib_backend(args.gui, backend)

File D:\Environment\ANACONDA\envs\Torch\lib\site-packages\IPython\core\interactiveshell.py:3588, in InteractiveShell.enable_matplotlib(self, gui)
   3567 def enable_matplotlib(self, gui=None):
   3568     """Enable interactive matplotlib and inline figure support.
   3569
   3570     This takes the following steps:
   (...)
   3586         display figures inline.
   3587     """
-> 3588     from matplotlib_inline.backend_inline import configure_inline_support
   3590     from IPython.core import pylabtools as pt
   3591     gui, backend = pt.find_gui_and_backend(gui, self.pylab_gui_select)

File D:\Environment\ANACONDA\envs\Torch\lib\site-packages\matplotlib_inline\__init__.py:1
----> 1 from . import backend_inline, config  # noqa
      2 __version__ = "0.1.6"

File D:\Environment\ANACONDA\envs\Torch\lib\site-packages\matplotlib_inline\backend_inline.py:6
      1 """A matplotlib backend for publishing figures via display_data"""
      3 # Copyright (c) IPython Development Team.
      4 # Distributed under the terms of the BSD 3-Clause License.
----> 6 import matplotlib
      7 from matplotlib import colors
      8 from matplotlib.backends import backend_agg

File D:\Environment\ANACONDA\envs\Torch\lib\site-packages\matplotlib\__init__.py:156
    152 from packaging.version import parse as parse_version
    154 # cbook must import matplotlib only within function
    155 # definitions, so it is safe to import from it here.
--> 156 from . import _api, _version, cbook, _docstring, rcsetup
    157 from matplotlib.cbook import sanitize_sequence
    158 from matplotlib._api import MatplotlibDeprecationWarning

File D:\Environment\ANACONDA\envs\Torch\lib\site-packages\matplotlib\rcsetup.py:27
     25 from matplotlib import _api, cbook
     26 from matplotlib.cbook import ls_mapper
---> 27 from matplotlib.colors import Colormap, is_color_like
     28 from matplotlib._fontconfig_pattern import parse_fontconfig_pattern
     29 from matplotlib._enums import JoinStyle, CapStyle

File D:\Environment\ANACONDA\envs\Torch\lib\site-packages\matplotlib\colors.py:56
     54 import matplotlib as mpl
     55 import numpy as np
---> 56 from matplotlib import _api, _cm, cbook, scale
     57 from ._color_data import BASE_COLORS, TABLEAU_COLORS, CSS4_COLORS, XKCD_COLORS
     60 class _ColorMapping(dict):

File D:\Environment\ANACONDA\envs\Torch\lib\site-packages\matplotlib\scale.py:22
     20 import matplotlib as mpl
     21 from matplotlib import _api, _docstring
---> 22 from matplotlib.ticker import (
     23     NullFormatter, ScalarFormatter, LogFormatterSciNotation, LogitFormatter,
     24     NullLocator, LogLocator, AutoLocator, AutoMinorLocator,
     25     SymmetricalLogLocator, AsinhLocator, LogitLocator)
     26 from matplotlib.transforms import Transform, IdentityTransform
     29 class ScaleBase:

File D:\Environment\ANACONDA\envs\Torch\lib\site-packages\matplotlib\ticker.py:138
    136 import matplotlib as mpl
    137 from matplotlib import _api, cbook
--> 138 from matplotlib import transforms as mtransforms
    140 _log = logging.getLogger(__name__)
    142 __all__ = ('TickHelper', 'Formatter', 'FixedFormatter',
    143            'NullFormatter', 'FuncFormatter', 'FormatStrFormatter',
    144            'StrMethodFormatter', 'ScalarFormatter', 'LogFormatter',
   (...)
    150            'MultipleLocator', 'MaxNLocator', 'AutoMinorLocator',
    151            'SymmetricalLogLocator', 'AsinhLocator', 'LogitLocator')

File D:\Environment\ANACONDA\envs\Torch\lib\site-packages\matplotlib\transforms.py:49
     46 from numpy.linalg import inv
     48 from matplotlib import _api
---> 49 from matplotlib._path import (
     50     affine_transform, count_bboxes_overlapping_bbox, update_path_extents)
     51 from .path import Path
     53 DEBUG = False

ImportError: DLL load failed while importing _path: 找不到指定的模块。

Problem Statement
(使用matplotlib库时出现的BUG:动态图片无法显示)
在运行:
plt_intuition(x_train,y_train) 会出现以下错误:
这里结合上面提到的文章可以将显示动画的
%matplotlib widget改为:
%matplotlib inline图片将可以显示,结果如下:
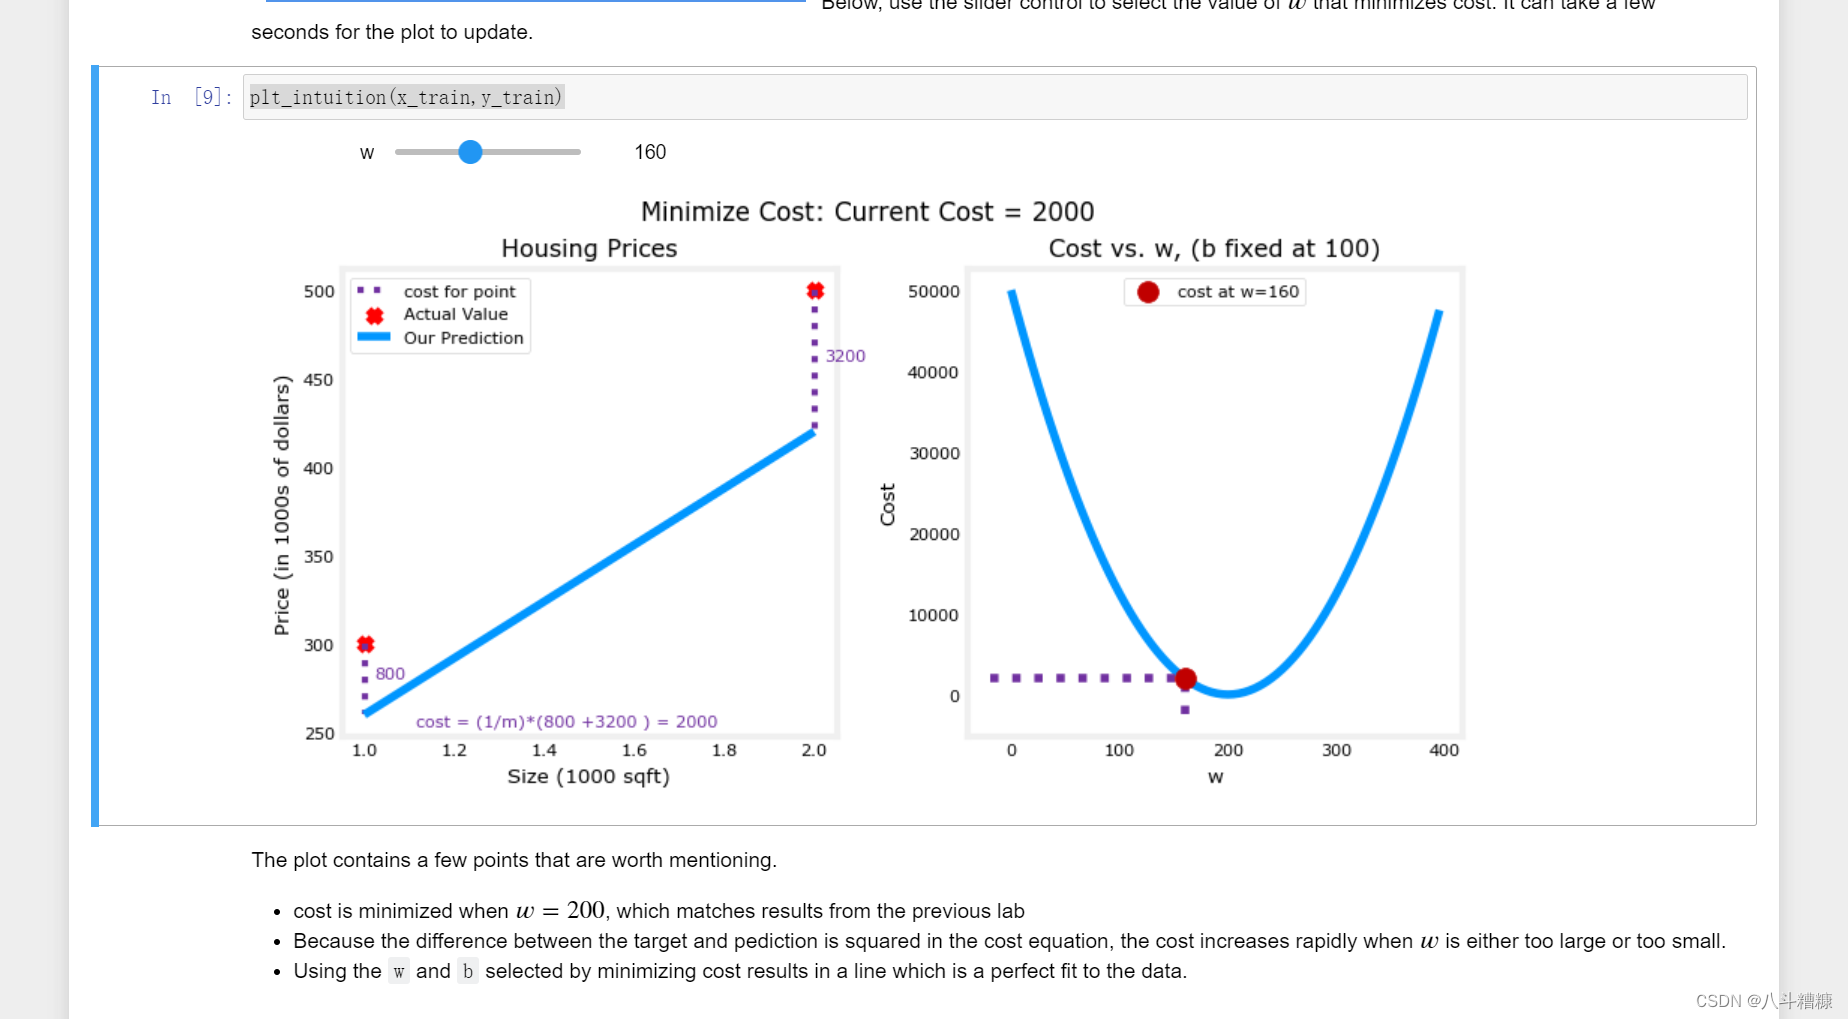
接下来的图片也都不会出现问题了。
#咳咳
更新一下由于使用%matplotlib inline无法进行动态互动,再次经过摸索发现,使用widget需要几个前提条件:
(注意:一下库的安装均需要在jupyter notebook的Terminal中进行)
1、安装ipywidgets
pip install ipywidgets2、安装widgetsnbextension
pip install widgetsnbextension3、启用ipywidgets拓展!!!这步很重要
jupyter nbextension enable --py widgetsnbextension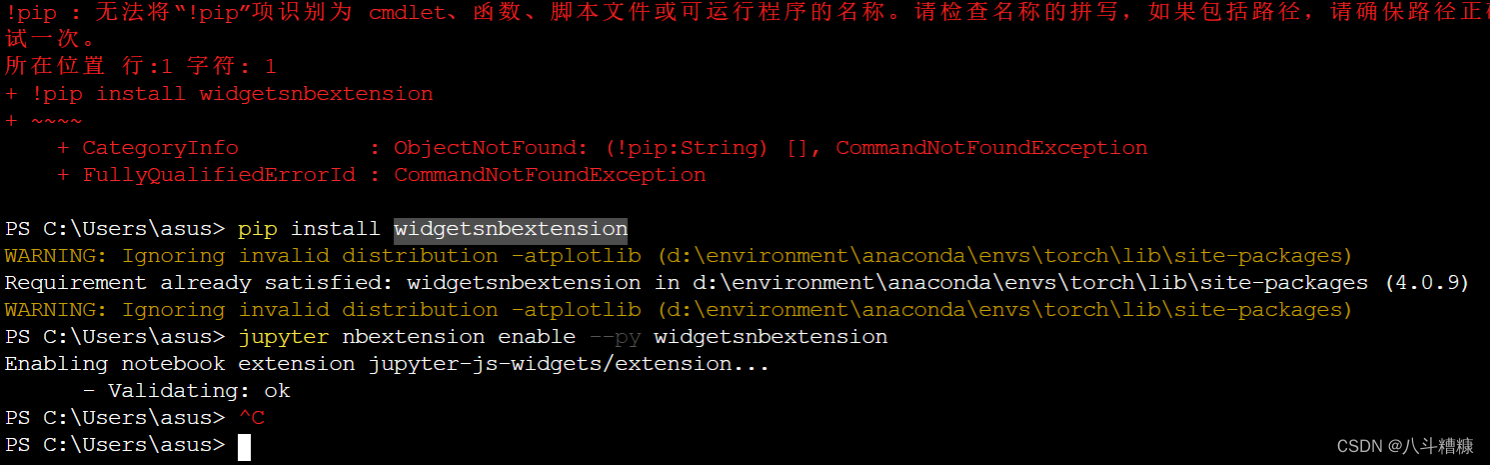
之后%matplotlib widgets就可以正常使用了,这里就可以进行互动了。

参考此处


 2929
2929


 被折叠的 条评论
为什么被折叠?
被折叠的 条评论
为什么被折叠?
 到【灌水乐园】发言


