


docker+springboot2+Prometheus+Grafana
时间紧迫直接上重点
本文参考链接
本文使用的是ubuntu-16.04.5-server-amd64
安装docker
apt-get install -y docker.io
下载镜像
docker pull prom/node-exporter
docker pull prom/prometheus
docker pull grafana/grafana
docker run -d -p 9100:9100 \
  -v "/proc:/host/proc:ro" \
  -v "/sys:/host/sys:ro" \
  -v "/:/rootfs:ro" \
  --net="host" \
  prom/node-exporter
http://192.168.91.132:9100/metrics 能访问到表示成功了
mkdir /opt/prometheus
cd /opt/prometheus/
vim prometheus.yml
# my global config
global:
scrape_interval: 15s # Set the scrape interval to every 15 seconds. Default is every 1 minute.
evaluation_interval: 15s # Evaluate rules every 15 seconds. The default is every 1 minute.
# scrape_timeout is set to the global default (10s).
# Load rules once and periodically evaluate them according to the global 'evaluation_interval'.
rule_files:
# - "first_rules.yml"
# - "second_rules.yml"
# A scrape configuration containing exactly one endpoint to scrape:
# Here it's Prometheus itself.
scrape_configs:
# The job name is added as a label `job=<job_name>` to any timeseries scraped from this config.
- job_name: 'prometheus'
# metrics_path defaults to '/metrics'
# scheme defaults to 'http'.
static_configs:
- targets: ['localhost:9090']
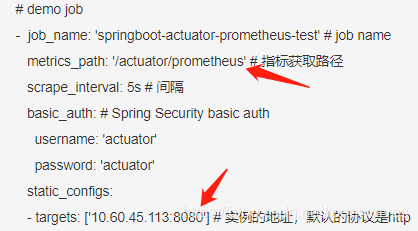
# demo job
- job_name: 'springboot-actuator-prometheus-test' # job name
metrics_path: '/actuator/prometheus' # 指标获取路径
scrape_interval: 5s # 间隔
basic_auth: # Spring Security basic auth
username: 'actuator'
password: 'actuator'
static_configs:
- targets: ['10.60.45.113:8080'] # 实例的地址,默认的协议是http
替换的内容
docker run  -d \
  -p 9090:9090 \
  -v /opt/prometheus/prometheus.yml:/etc/prometheus/prometheus.yml  \
  prom/prometheus
http://192.168.91.132:9090/graph 能访问到表示ok
http://192.168.91.132:9090/targets 范文所有的targets
新建空文件夹grafana-storage,用来存储数据
mkdir /opt/grafana-storage
设置权限
chmod 777 -R /opt/grafana-storage
因为grafana用户会在这个目录写入文件,直接设置777,比较简单粗暴!
启动grafana
docker run -d \
  -p 3000:3000 \
  --name=grafana \
  -v /opt/grafana-storage:/var/lib/grafana \
  grafana/grafana
http://192.168.91.132:3000/ 能访问到表示启动成功
默认的用户名和密码都是admin
登入之后会让你重新设置
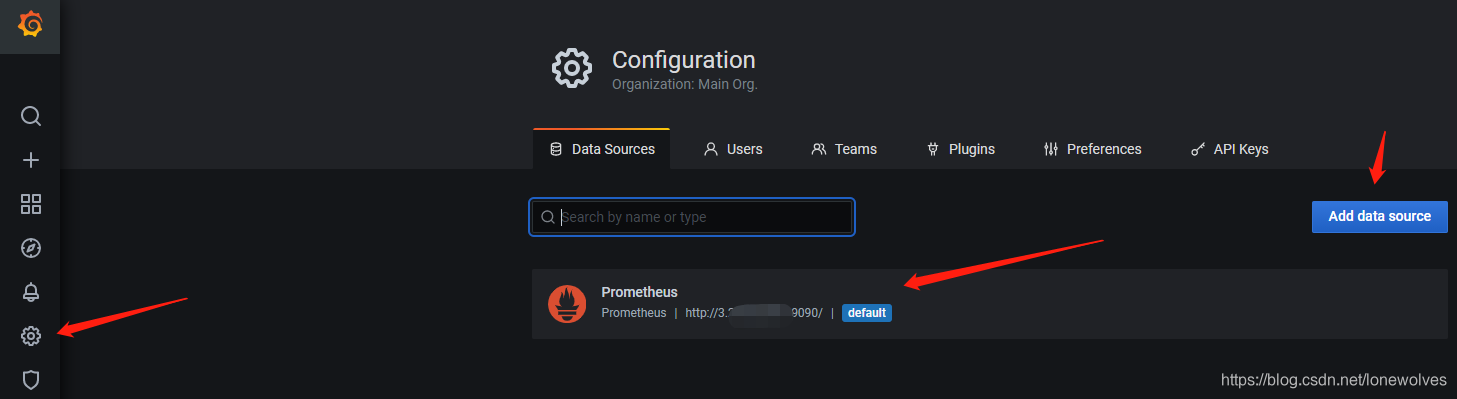
Add data source
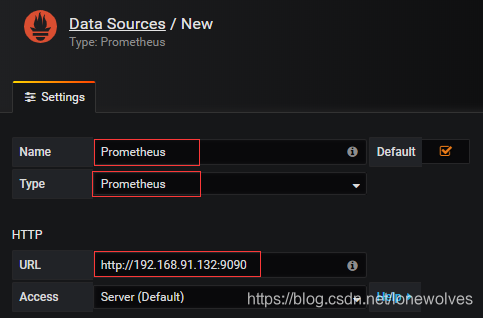
点击下面的Save & Test,如果出现绿色的,说明ok了
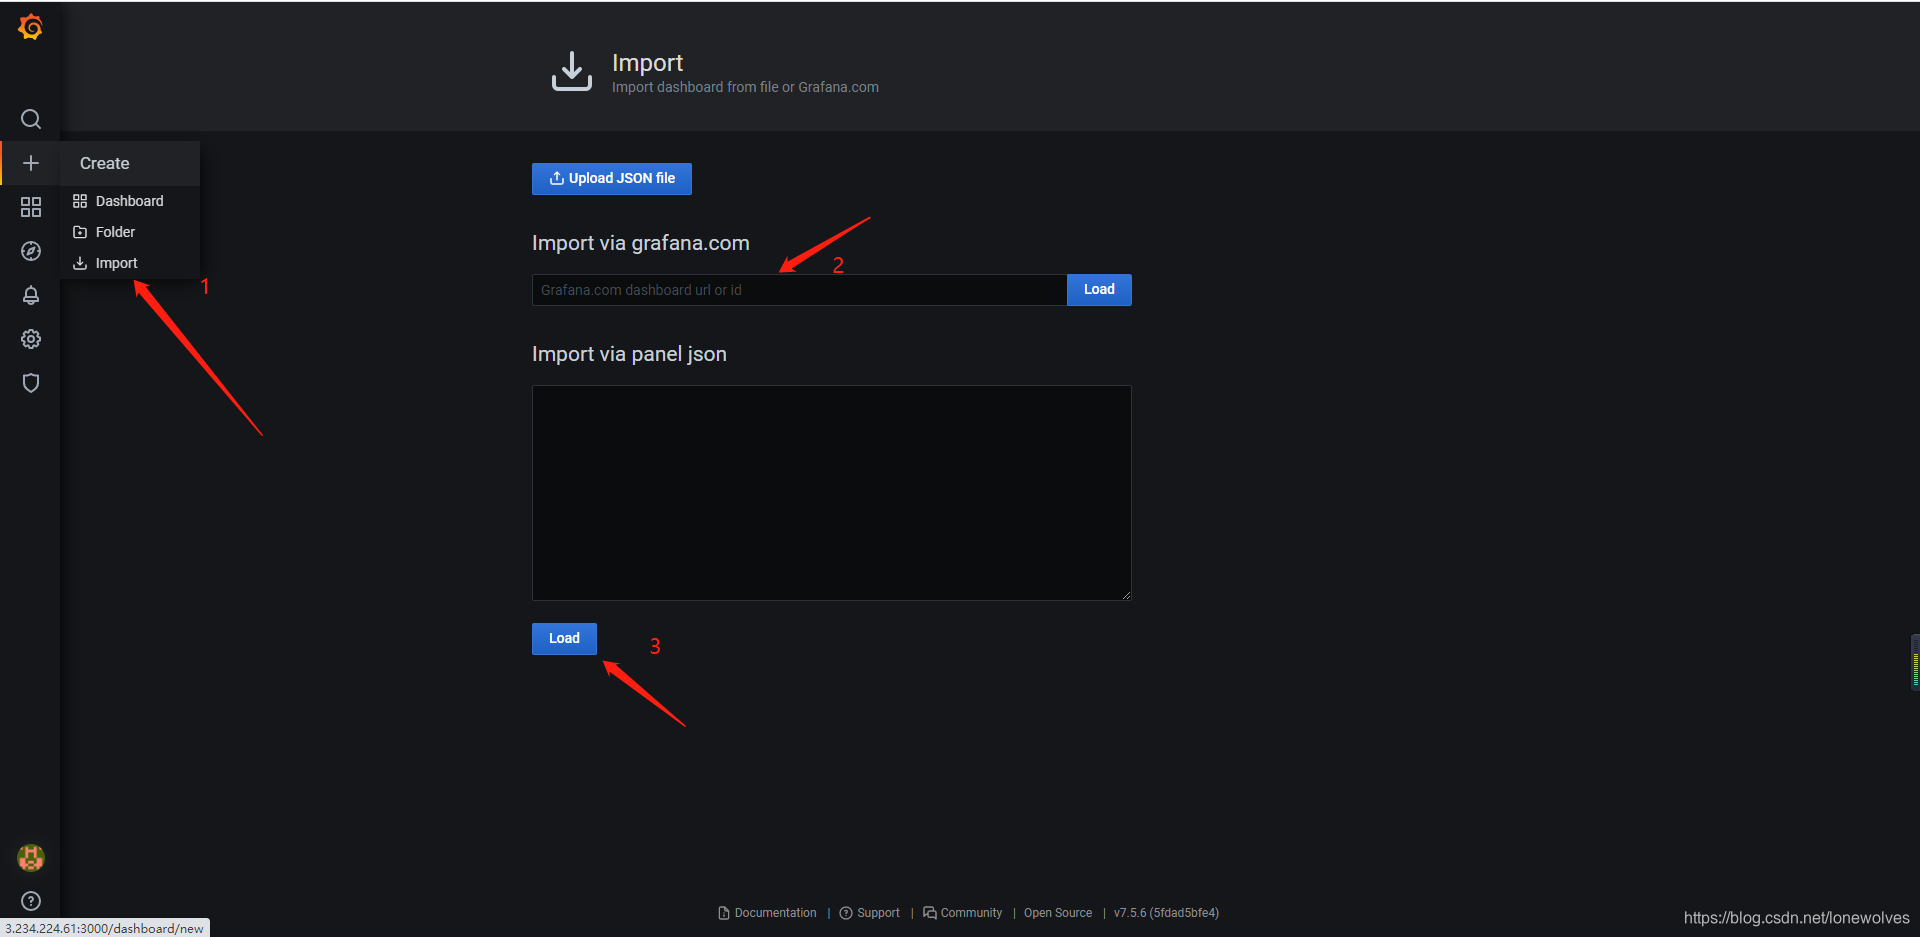
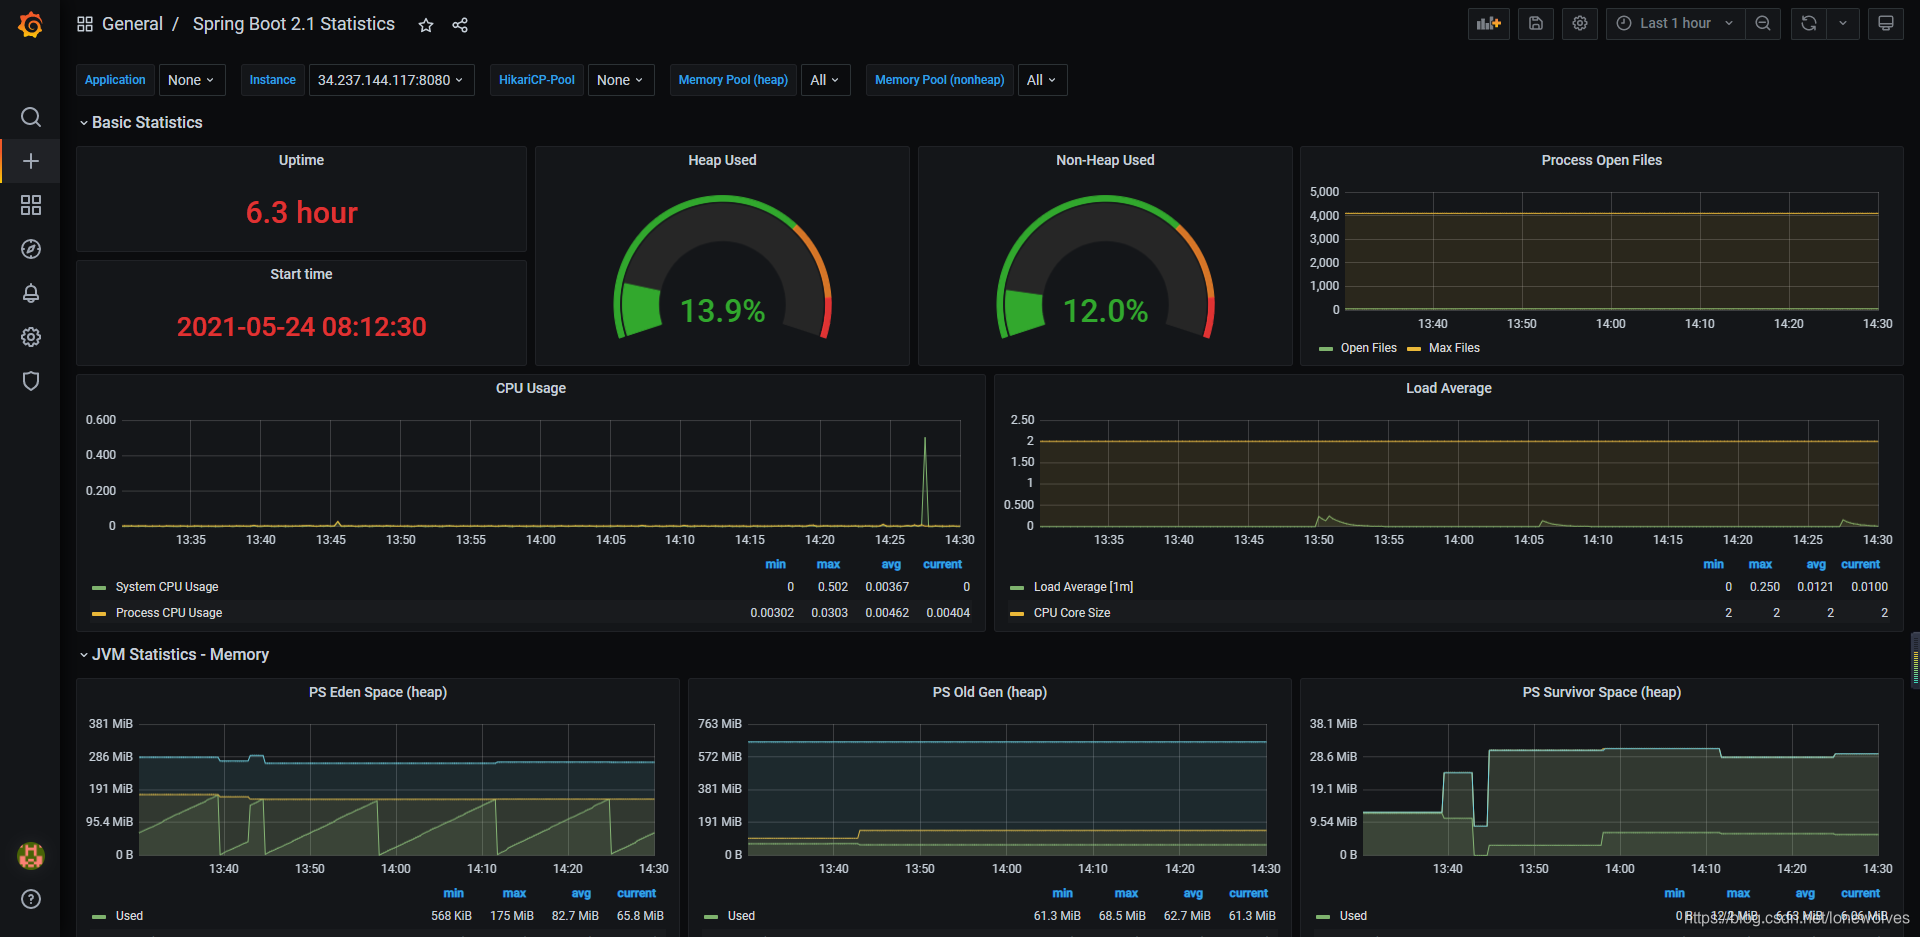
这些都ok了的话添加两个视图 :jvm 4701 springboot2 10280
效果

好了到这里结束了--------------------------------------


 959
959

 被折叠的 条评论
为什么被折叠?
被折叠的 条评论
为什么被折叠?
 到【灌水乐园】发言


