


2021年6月manim安装教程
介绍manim
Manim是一个用于精确程序动画的引擎,专为创建解释性数学视频而设计。想必数学老师最需要这个。
Windows安装——准备篇
- 安装Git
Git下载链接 - 安装Anaconda
最新版Anaconda官方下载链接 需要将网页一直下拉到底部才可以看得到
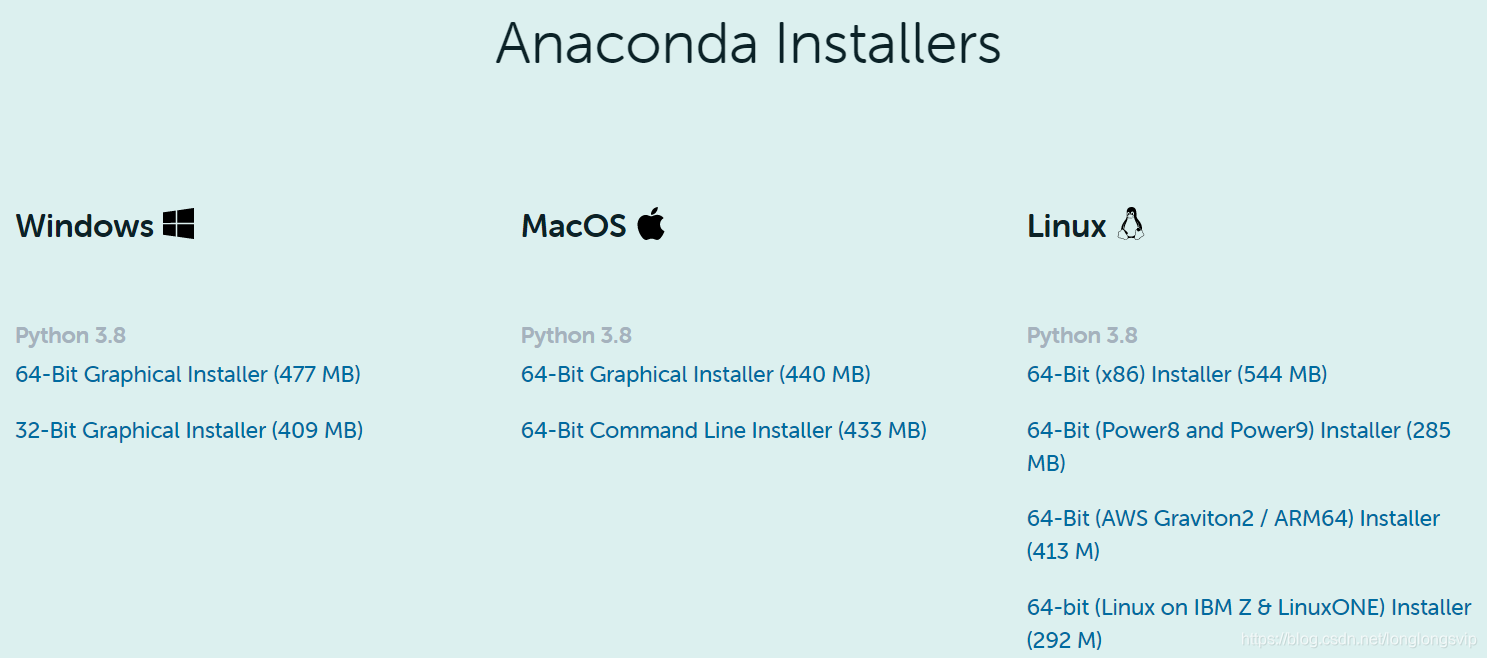
最新版Anaconda网盘下载链接 仅提供64位 - 安装Tex Live-Full版本
最新版Tex Live-Full官方下载链接
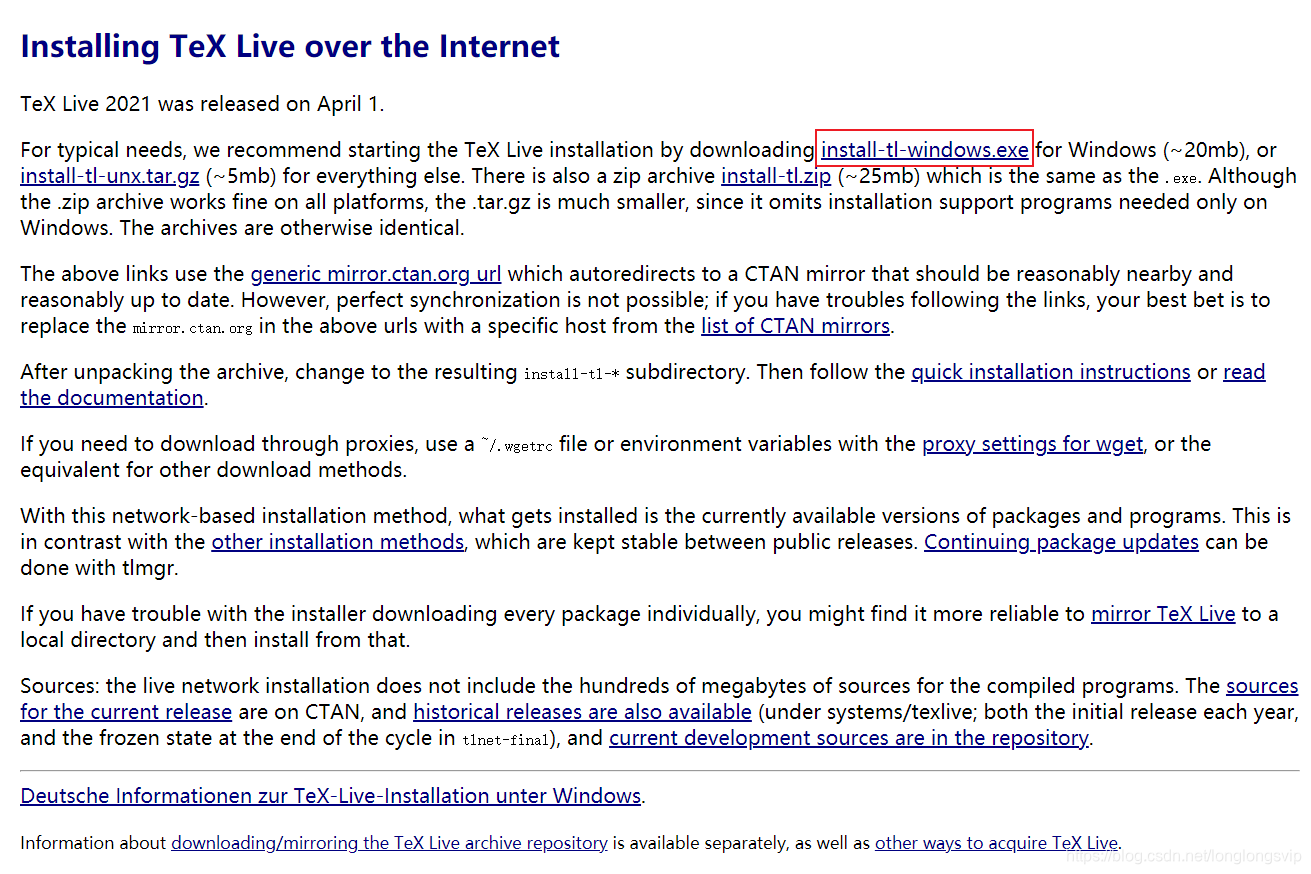
下载得到的是TexLive的网络安装器,运行网络安装器再下载Tex Live,安装速度因网速而有差异,请耐心等待。
最新版离线版Tex Live-Full下载链接,具体网站是https://mirrors.sjtug.sjtu.edu.cn/ctan/systems/texlive/Images/ - 下载FFmpeg并配置
FFmpeg官方下载链接
FFmpeg离线版下载链接
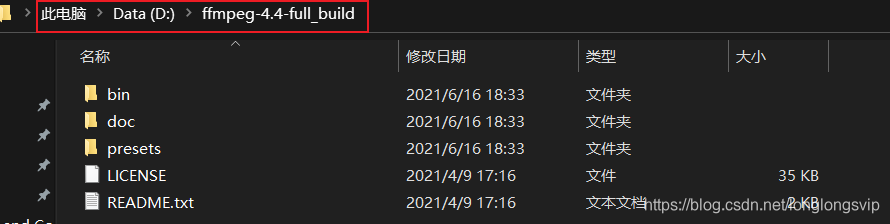
下载完成后,解压到你想解压的地方,如下所示
打开环境变量,配置,如下所示
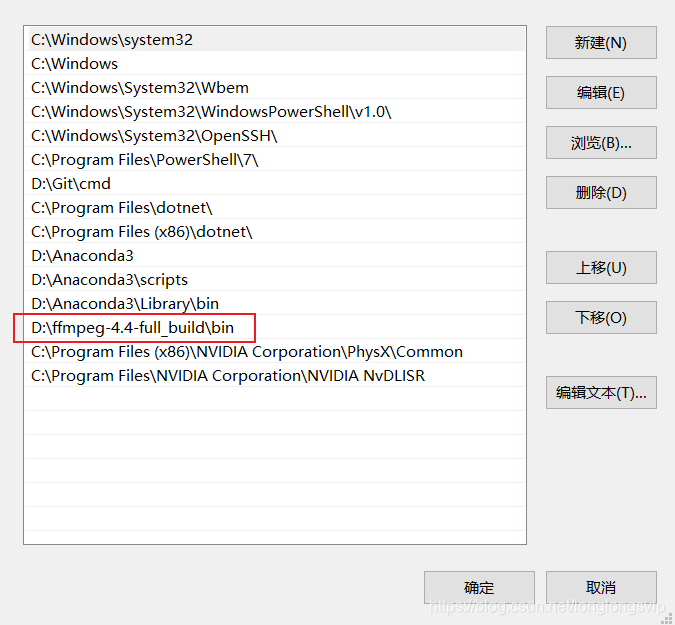
测试FFmpeg,打开cmd,输入ffmpeg -version,如下所示则安装和配置FFmpeg成功

Windows安装——安装篇
- 选择一个硬盘根目录右键打开Git Bash here,如下所示:
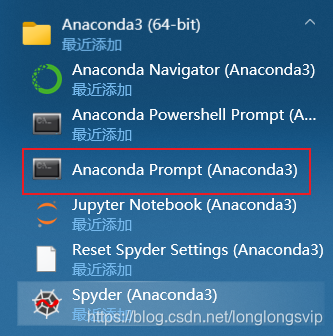
git clone https://github.com/3b1b/manim.git获取最新manim码源- 此时使用Anaconda Prompt (Anaconda3)终端
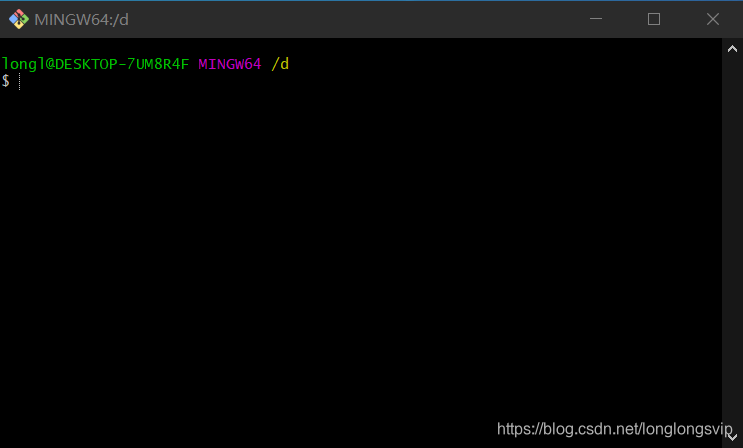
cd manim进到manim码源文件夹,此前你还需要首先进入到manim的此盘根目录,如果根目录为D盘,那么依次输入一下命令
d:
cd manim

conda create -n manim python=3.8创建专门为manim使用的虚拟Python环境conda activate manim激活专门为manim使用的虚拟Python环境——manimpip install -e .正式安装manim- 安装后,manim在Anaconda文件夹中的enves中的manim文件夹中
- 安装时涉及网络问题,请提前做好网络环境或换源的准备
- 我再安装过程中,没有遇到报错的问题,如遇到报错问题,请在文章评论区评论,我会试着给予解答。
Windows安装——测试
- 打开Python的开发工具,我这里用的是Visual Studio Code,PyCharm等开发工具也可以的
- 建立code.py
- 测试代码
from manimlib import *
class GraphExample(Scene):
    def construct(self):
        axes = Axes((-3, 10), (-1, 8))
        axes.add_coordinate_labels()

        self.play(Write(axes, lag_ratio=0.01, run_time=1))

        # Axes.get_graph will return the graph of a function
        sin_graph = axes.get_graph(
            lambda x: 2 * math.sin(x),
            color=BLUE,
        )
        # By default, it draws it so as to somewhat smoothly interpolate
        # between sampled points (x, f(x)).  If the graph is meant to have
        # a corner, though, you can set use_smoothing to False
        relu_graph = axes.get_graph(
            lambda x: max(x, 0),
            use_smoothing=False,
            color=YELLOW,
        )
        # For discontinuous functions, you can specify the point of
        # discontinuity so that it does not try to draw over the gap.
        step_graph = axes.get_graph(
            lambda x: 2.0 if x > 3 else 1.0,
            discontinuities=[3],
            color=GREEN,
        )

        # Axes.get_graph_label takes in either a string or a mobject.
        # If it's a string, it treats it as a LaTeX expression.  By default
        # it places the label next to the graph near the right side, and
        # has it match the color of the graph
        sin_label = axes.get_graph_label(sin_graph, "\\sin(x)")
        relu_label = axes.get_graph_label(relu_graph, Text("ReLU"))
        step_label = axes.get_graph_label(step_graph, Text("Step"), x=4)

        self.play(
            ShowCreation(sin_graph),
            FadeIn(sin_label, RIGHT),
        )
        self.wait(2)
        self.play(
            ReplacementTransform(sin_graph, relu_graph),
            FadeTransform(sin_label, relu_label),
        )
        self.wait()
        self.play(
            ReplacementTransform(relu_graph, step_graph),
            FadeTransform(relu_label, step_label),
        )
        self.wait()

        parabola = axes.get_graph(lambda x: 0.25 * x**2)
        parabola.set_stroke(BLUE)
        self.play(
            FadeOut(step_graph),
            FadeOut(step_label),
            ShowCreation(parabola)
        )
        self.wait()

        # You can use axes.input_to_graph_point, abbreviated
        # to axes.i2gp, to find a particular point on a graph
        dot = Dot(color=RED)
        dot.move_to(axes.i2gp(2, parabola))
        self.play(FadeIn(dot, scale=0.5))

        # A value tracker lets us animate a parameter, usually
        # with the intent of having other mobjects update based
        # on the parameter
        x_tracker = ValueTracker(2)
        f_always(
            dot.move_to,
            lambda: axes.i2gp(x_tracker.get_value(), parabola)
        )

        self.play(x_tracker.animate.set_value(4), run_time=3)
        self.play(x_tracker.animate.set_value(-2), run_time=3)
        self.wait()
- 保存code.py文件
- 在终端输入
manimgl code.py运行程序 - 线条和图不显示,这是因为Intel GPU和OpenGL存在不兼容的问题,如果你的PC是Intel GPU+Nvidia GPU的双显卡,那么解决办法是
- 在桌面右键打开Nvidai控制面板
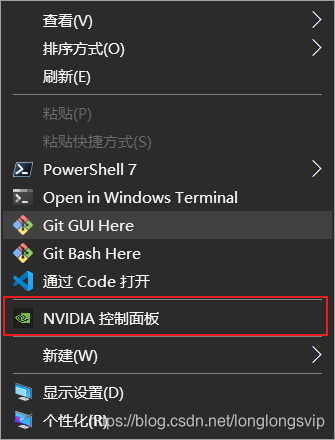
- 打开管理3D设置,首选图形处理器选择高性能NVIDIA处理器

- AMD GPU我认为也是类似的选择
- 在桌面右键打开Nvidai控制面板
- 重新运行code.py


 1775
1775


 被折叠的 条评论
为什么被折叠?
被折叠的 条评论
为什么被折叠?
 到【灌水乐园】发言


