


1、CANVAS 概念
<canvas> 是 HTML5 新增的,一个可以使用 js 在其中绘制图像的 HTML 元素。它可以用来制作动画。Canvas是画布,通过Javascript来绘制2D图形,是逐像素进行渲染的。
2、基础案例
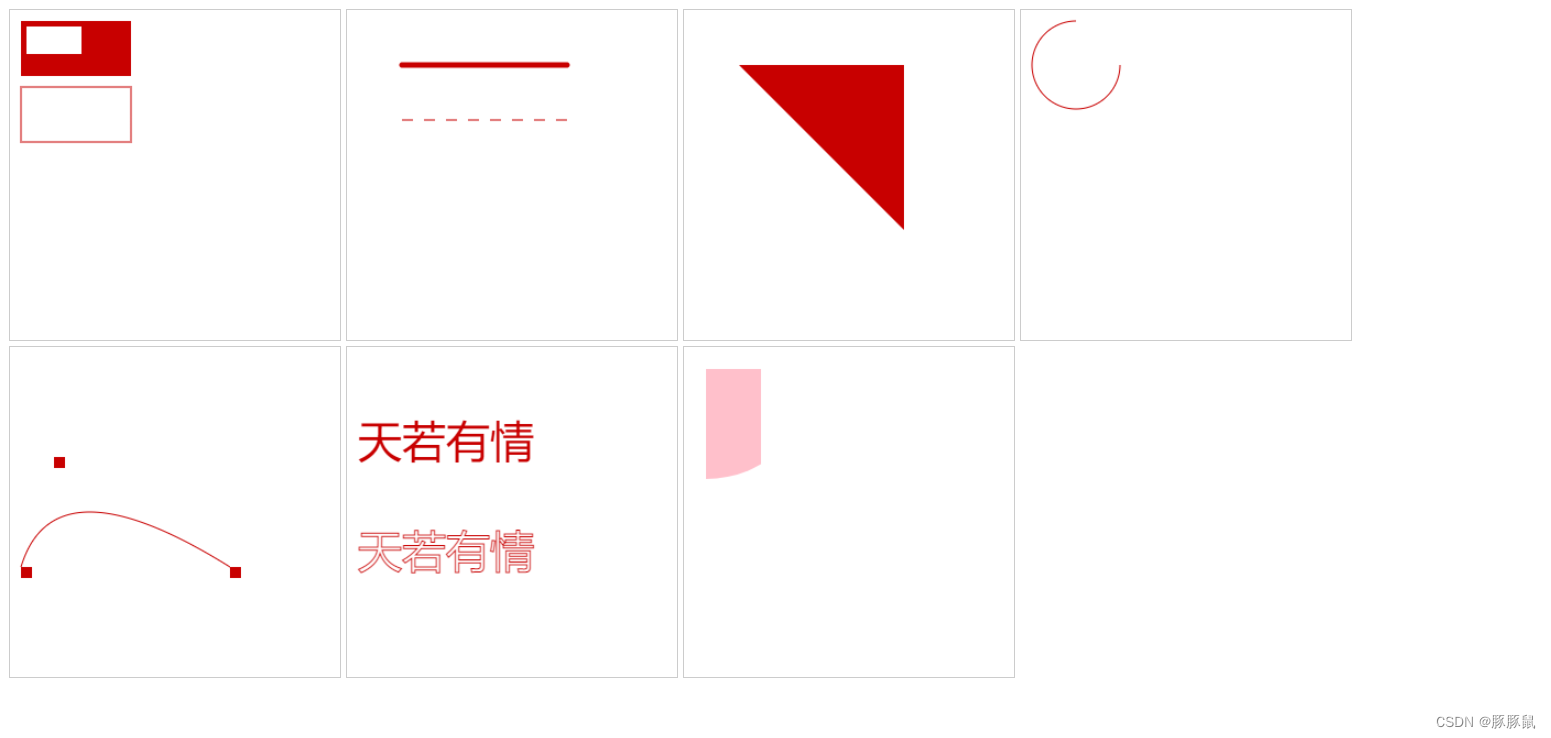
💡 Tips:实现 矩形、线段、三角形、圆弧、贝塞尔曲线、文本 等基础图形
<!DOCTYPE html>
<html lang="en">
  <head>
    <meta charset="UTF-8" />
    <meta http-equiv="X-UA-Compatible" content="IE=edge" />
    <meta name="viewport" content="width=device-width, initial-scale=1.0" />
    <title>Document</title>
  </head>
  <style>
    .canvas {
      border: 1px solid #ccc;
    }
  </style>
  <body>
    <!-- 矩形 -->
    <canvas id="demo1" width="300" height="300" class="canvas"></canvas>
    <!-- 线 -->
    <canvas id="demo2" width="300" height="300" class="canvas"></canvas>
    <!-- 三角形 -->
    <canvas id="demo3" width="300" height="300" class="canvas"></canvas>
    <!-- 圆弧 -->
    <canvas id="demo4" width="300" height="300" class="canvas"></canvas>
    <!-- 二次贝塞尔曲线 -->
    <canvas id="demo5" width="300" height="300" class="canvas"></canvas>
    <!-- 文本 -->
    <canvas id="demo6" width="300" height="300" class="canvas"></canvas>
    <!-- 裁剪 -->
    <canvas id="demo7" width="300" height="300" class="canvas"></canvas>
  </body>
  <script>
    const utils = {
      initDraw(id) {
        const ctx = document.getElementById(id).getContext('2d');
        ctx.fillStyle = 'rgb(200, 0, 0)'; // 填充颜色
        ctx.strokeStyle = 'rgb(200, 0, 0)'; // 描边颜色
        return ctx;
      },
    };

    const drawCanvas = {
      draw1() {
        const ctx = utils.initDraw('demo1');
        // 画矩形 x, y, widh, height
        ctx.fillRect(10, 10, 100, 50); // 填充
        ctx.strokeRect(10, 70, 100, 50); // 描边
        ctx.clearRect(15, 15, 50, 25); // 透明
      },
      draw2() {
        const ctx = utils.initDraw('demo2');
        ctx.beginPath();
        ctx.moveTo(50, 50);
        ctx.lineTo(200, 50);
        ctx.lineWidth = 5;
        ctx.lineCap = 'round'; // butt方形-默认值、square方形-外延
        ctx.stroke();

        // 虚线
        ctx.moveTo(50, 100);
        ctx.lineTo(200, 100);
        ctx.lineWidth = 1;
        ctx.setLineDash([10, 10]); // [实线长度, 间隙长度]
        ctx.lineDashOffset = 0;
        ctx.stroke();

        ctx.closePath();
      },
      draw3() {
        const ctx = utils.initDraw('demo3');
        ctx.beginPath();
        ctx.moveTo(50, 50);
        ctx.lineTo(200, 50);
        ctx.lineTo(200, 200);
        // ctx.closePath(); // 虽然我们只绘制了两条线段,但是closePath会closePath,仍然是一个3角形
        // ctx.stroke(); // 描边。stroke不会自动closePath()

        ctx.fill(); //填充闭合区域。如果path没有闭合,则fill()会自动闭合路径。
      },
      draw4() {
        const ctx = utils.initDraw('demo4');
        // arc(x, y, r, startAngle, endAngle, anticlockwise): 以(x, y) 为圆心,以r 为半径,从 startAngle 弧度开始到endAngle弧度结束。anticlosewise 是布尔值,true 表示逆时针,false 表示顺时针(默认是顺时针)。
        ctx.beginPath();
        ctx.arc(50, 50, 40, 0, (Math.PI / 180) * 270, false);
        // ctx.closePath();
        ctx.stroke();
      },
      draw5() {
        const ctx = utils.initDraw('demo5');
        const sx = 10,
          sy = 200; // 起始点
        const cp1x = 40,
          cp1y = 100; // 控制点
        const x = 200,
          y = 200; // 结束点

        ctx.beginPath();
        ctx.moveTo(sx, sy);
        // 绘制二次贝塞尔曲线 quadraticCurveTo(cp1x, cp1y, x, y) 参数 1 和 2:控制点坐标 参数 3 和 4:结束点坐标
        ctx.quadraticCurveTo(cp1x, cp1y, x, y);
        ctx.stroke();

        ctx.beginPath();
        ctx.rect(sx, sy, 10, 10);
        ctx.rect(cp1x, cp1y, 10, 10);
        ctx.rect(x, y, 10, 10);
        ctx.fill();
      },
      draw6() {
        const ctx = utils.initDraw('demo6');
        ctx.font = '40px sans-serif'; // 字符串使用和 CSS font 属性相同的语法
        ctx.fillText('天若有情', 10, 100);
        ctx.strokeText('天若有情', 10, 200);
      },
      draw7() {
        const ctx = utils.initDraw('demo7');
        ctx.beginPath();
        ctx.arc(20, 20, 100, 0, Math.PI * 2);
        ctx.clip();

        ctx.fillStyle = 'pink';
        ctx.fillRect(20, 20, 50, 100);
      },
    };

    for (let key in drawCanvas) {
      drawCanvas[key]();
    }
  </script>
</html>
效果图如下:
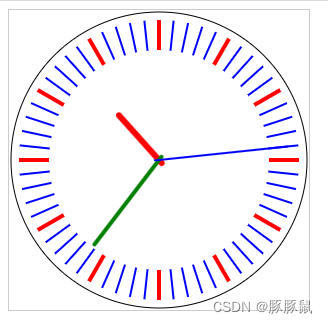
3、CANVAS 实现时钟
<!DOCTYPE html>
<html lang="en">
  <head>
    <meta charset="UTF-8" />
    <meta http-equiv="X-UA-Compatible" content="IE=edge" />
    <meta name="viewport" content="width=device-width, initial-scale=1.0" />
    <title>Document</title>
  </head>
  <style>
    .canvas {
      border: 1px solid #ccc;
    }
  </style>
  <body>
    <!-- 时钟 -->
    <canvas id="demo" width="300" height="300" class="canvas"></canvas>
  </body>
  <script>
    const ctx = document.getElementById('demo').getContext('2d');
    requestAnimationFrame(function step() {
      drawDial(ctx); //绘制表盘
      drawAllHands(ctx); //绘制时分秒针
      requestAnimationFrame(step);
    });

    /*绘制表盘*/
    function drawDial(ctx) {
      let pi = Math.PI;

      ctx.clearRect(0, 0, 300, 300); //清除所有内容
      ctx.save();

      ctx.translate(150, 150); //一定坐标原点到原来的中心
      ctx.beginPath();
      ctx.arc(0, 0, 148, 0, 2 * pi); //绘制圆周
      ctx.stroke();
      ctx.closePath();

      for (let i = 0; i < 60; i++) {
        //绘制刻度。
        ctx.save();
        ctx.rotate(-pi / 2 + (i * pi) / 30); //旋转坐标轴。坐标轴x的正方形从 向上开始算起
        ctx.beginPath();
        ctx.moveTo(110, 0);
        ctx.lineTo(140, 0);
        ctx.lineWidth = i % 5 ? 2 : 4;
        ctx.strokeStyle = i % 5 ? 'blue' : 'red';
        ctx.stroke();
        ctx.closePath();
        ctx.restore();
      }
      ctx.restore();
    }
    /*绘制时分秒针*/
    function drawAllHands(ctx) {
      let time = new Date();

      let s = time.getSeconds();
      let m = time.getMinutes();
      let h = time.getHours();

      let pi = Math.PI;
      let secondAngle = (pi / 180) * 6 * s; //计算出来s针的弧度
      let minuteAngle = (pi / 180) * 6 * m + secondAngle / 60; //计算出来分针的弧度
      let hourAngle = (pi / 180) * 30 * h + minuteAngle / 12; //计算出来时针的弧度

      drawHand(hourAngle, 60, 6, 'red', ctx); //绘制时针
      drawHand(minuteAngle, 106, 4, 'green', ctx); //绘制分针
      drawHand(secondAngle, 129, 2, 'blue', ctx); //绘制秒针
    }
    /*绘制时针、或分针、或秒针
     * 参数1:要绘制的针的角度
     * 参数2:要绘制的针的长度
     * 参数3:要绘制的针的宽度
     * 参数4:要绘制的针的颜色
     * 参数4:ctx
     * */
    function drawHand(angle, len, width, color, ctx) {
      ctx.save();
      ctx.translate(150, 150); //把坐标轴的远点平移到原来的中心
      ctx.rotate(-Math.PI / 2 + angle); //旋转坐标轴。 x轴就是针的角度
      ctx.beginPath();
      ctx.moveTo(-4, 0);
      ctx.lineTo(len, 0); // 沿着x轴绘制针
      ctx.lineWidth = width;
      ctx.strokeStyle = color;
      ctx.lineCap = 'round';
      ctx.stroke();
      ctx.closePath();
      ctx.restore();
    }
  </script>
</html>
效果图如下:
4、扩展
- canvas 可实现 折线图、柱状图等基础图表,也可实现各种定制性图形,可扩展性非常强。
- 现成的基于 canvas 的二次封装库也有很多,工作中常见的如下:
echarts
three.js - canvas 学习链接如下:
学习 HTML5 Canvas | 菜鸟教程
canvas基础-CSDN博客


 被折叠的 条评论
为什么被折叠?
被折叠的 条评论
为什么被折叠?
 到【灌水乐园】发言


