


Diagrams
一、关于 Diagram as Code
- github : https://github.com/mingrammer/diagrams
- 官方文档:https://diagrams.mingrammer.com/
- 示例:https://diagrams.mingrammer.com/docs/getting-started/examples
- 贡献指南
Diagrams 允许您在Python代码中绘制云系统架构。它是为在没有任何设计工具的情况下制作原型新系统架构设计而诞生的。您也可以描述或可视化现有的系统架构。
图表目前支持主要的主要提供商,包括:AWS、Azure、GCP、Kubernetes、Alibaba Cloud、Oracle Cloud等…它还支持On-Premise节点、SaaS和主要Programming框架和语言。
Diagram as Code 还允许您跟踪任何版本管理系统中的架构图更改。
注意:它不控制任何实际的云资源,也不生成云形成或地形代码。它仅用于绘制云系统架构图。
Providers
二、快速上手
1、安装
要求:
1、Python3.7 +
2、Graphviz
它使用Graphviz来渲染图表,所以你需要安装Graphviz来使用图表。安装Graphviz(或已经有了)后,安装图表。
如果您使用的是Homebrew,macOS用户可以通过brew install graphviz下载Graphviz。
pip:
pip install diagrams
其它
# using pipenv
$ pipenv install diagrams

# using poetry
$ poetry add diagrams
您可以从快速入门开始。查看指南了解更多详细信息,您可以在这里找到所有可用节点列表。
2、Python 调用
# diagram.py
from diagrams import Diagram
from diagrams.aws.compute import EC2
from diagrams.aws.database import RDS
from diagrams.aws.network import ELB

with Diagram("Web Service", show=False):
    ELB("lb") >> EC2("web") >> RDS("userdb")
This code generates below diagram.
$ python diagram.py

他会再你的工作目录保存为 web_service.png
三、使用介绍
1、基本
图表示全局图上下文。
您可以使用关系图类创建关系图上下文。关系图构造函数的第一个参数将用于输出文件名。
from diagrams import Diagram
from diagrams.aws.compute import EC2

with Diagram("Simple Diagram"):
    EC2("web")
如果您使用以下命令运行上述脚本,
$ python diagram.py
它将生成一个图像文件,其中单个EC2节点在您的工作目录中绘制为simple_diagram.png,并立即打开创建的图像文件。
2、jupyter
图表也可以直接在笔记本内部呈现,如下所示:
from diagrams import Diagram
from diagrams.aws.compute import EC2

with Diagram("Simple Diagram") as diag:
    EC2("web")
diag
3、选项
您可以使用outformat参数指定输出文件格式。默认为png。
(png、jpg、svg、pdf和dot)是允许的。
from diagrams import Diagram
from diagrams.aws.compute import EC2

with Diagram("Simple Diagram", outformat="jpg"):
    EC2("web")
该outformat参数还支持list在一次调用中输出所有定义的输出。
from diagrams import Diagram
from diagrams.aws.compute import EC2

with Diagram("Simple Diagram Multi Output", outformat=["jpg", "png", "dot"]):
    EC2("web")
您可以使用filename参数指定输出文件名。扩展名不应该包括在内,它由outformat参数决定。
from diagrams import Diagram
from diagrams.aws.compute import EC2

with Diagram("Simple Diagram", filename="my_diagram"):
    EC2("web")
您也可以通过将show参数设置为false来禁用自动文件打开。默认为真。
from diagrams import Diagram
from diagrams.aws.compute import EC2

with Diagram("Simple Diagram", show=False):
    EC2("web")
它允许自定义Graphviz点属性选项。
graph_attr,node_attr和edge_attr被支持。这里有一个参考链接。
from diagrams import Diagram
from diagrams.aws.compute import EC2

graph_attr = {
    "fontsize": "45",
    "bgcolor": "transparent"
}

with Diagram("Simple Diagram", show=False, graph_attr=graph_attr):
    EC2("web")
4、节点
节点是表示节点或系统组件的第二个对象。
基本
节点是一个抽象概念,表示单个系统组件对象。
节点对象由三部分组成:提供者、资源类型和名称。您可能已经在前面的示例中看到了每个部分。
from diagrams import Diagram
from diagrams.aws.compute import EC2

with Diagram("Simple Diagram"):
    EC2("web")
在上面的例子中,EC2是由aws提供者提供的compute资源类型的节点。
您可以以类似的方式使用其他节点对象,例如:
# aws resources
from diagrams.aws.compute import ECS, Lambda
from diagrams.aws.database import RDS, ElastiCache
from diagrams.aws.network import ELB, Route53, VPC
...

# azure resources
from diagrams.azure.compute import FunctionApps
from diagrams.azure.storage import BlobStorage
...

# alibaba cloud resources
from diagrams.alibabacloud.compute import ECS
from diagrams.alibabacloud.storage import ObjectTableStore
...

# gcp resources
from diagrams.gcp.compute import AppEngine, GKE
from diagrams.gcp.ml import AutoML
...

# k8s resources
from diagrams.k8s.compute import Pod, StatefulSet
from diagrams.k8s.network import Service
from diagrams.k8s.storage import PV, PVC, StorageClass
...

# oracle resources
from diagrams.oci.compute import VirtualMachine, Container
from diagrams.oci.network import Firewall
from diagrams.oci.storage import FileStorage, StorageGateway
You can find all available nodes list in Here.
5、Data Flow
You can represent data flow by connecting the nodes with these operators: >>, << and -.
- >>: Connect nodes in left to right direction.
- <<: Connect nodes in right to left direction.
- -: Connect nodes in no direction. Undirected.
from diagrams import Diagram
from diagrams.aws.compute import EC2
from diagrams.aws.database import RDS
from diagrams.aws.network import ELB
from diagrams.aws.storage import S3

with Diagram("Web Services", show=False):
    ELB("lb") >> EC2("web") >> RDS("userdb") >> S3("store")
    ELB("lb") >> EC2("web") >> RDS("userdb") << EC2("stat")
    (ELB("lb") >> EC2("web")) - EC2("web") >> RDS("userdb")
Be careful when using the
-and any shift operators together, which could cause unexpected results due to operator precedence.

呈现图表的顺序与声明顺序相反。
您可以使用方向参数更改数据流的direction。默认为LR。
(TB、BT、LR和RL)是允许的。
from diagrams import Diagram
from diagrams.aws.compute import EC2
from diagrams.aws.database import RDS
from diagrams.aws.network import ELB

with Diagram("Workers", show=False, direction="TB"):
    lb = ELB("lb")
    db = RDS("events")
    lb >> EC2("worker1") >> db
    lb >> EC2("worker2") >> db
    lb >> EC2("worker3") >> db
    lb >> EC2("worker4") >> db
    lb >> EC2("worker5") >> db

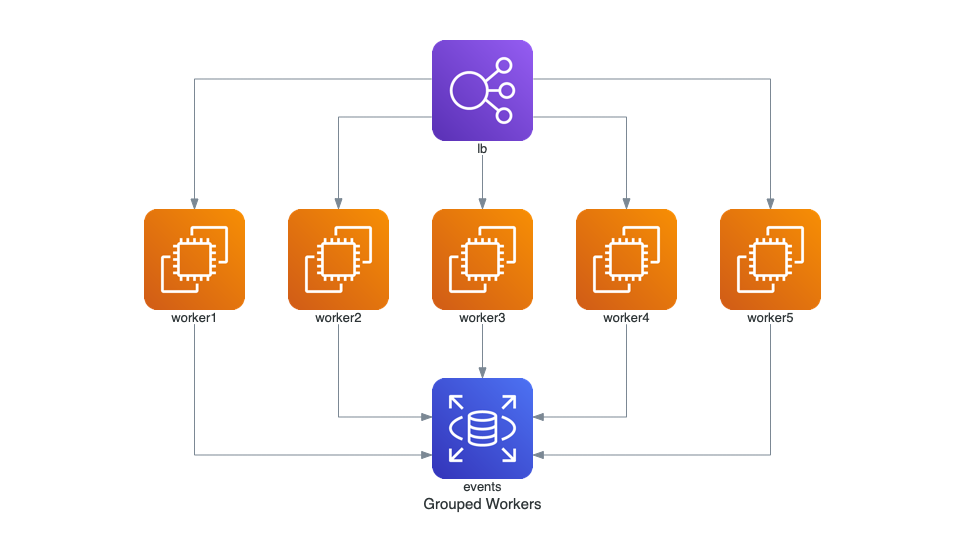
6、组数据流
上面的工作示例有太多冗余流。在这种情况下,您可以将节点分组到一个列表中,以便所有节点一次连接到其他节点。
from diagrams import Diagram
from diagrams.aws.compute import EC2
from diagrams.aws.database import RDS
from diagrams.aws.network import ELB

with Diagram("Grouped Workers", show=False, direction="TB"):
    ELB("lb") >> [EC2("worker1"),
                  EC2("worker2"),
                  EC2("worker3"),
                  EC2("worker4"),
                  EC2("worker5")] >> RDS("events")

您不能直接连接两个列表,因为Python中不允许列表之间的移位/算术运算。
7、集群
集群允许您对孤立组中的节点进行分组(或集群)。
基本
集群表示本地集群上下文。
您可以使用Cluster类创建集群上下文。您还可以将集群中的节点连接到集群外的其他节点。
from diagrams import Cluster, Diagram
from diagrams.aws.compute import ECS
from diagrams.aws.database import RDS
from diagrams.aws.network import Route53

with Diagram("Simple Web Service with DB Cluster", show=False):
    dns = Route53("dns")
    web = ECS("service")

    with Cluster("DB Cluster"):
        db_primary = RDS("primary")
        db_primary - [RDS("replica1"),
                     RDS("replica2")]

    dns >> web >> db_primary

8、嵌套集群
嵌套聚类也是可能的。
from diagrams import Cluster, Diagram
from diagrams.aws.compute import ECS, EKS, Lambda
from diagrams.aws.database import Redshift
from diagrams.aws.integration import SQS
from diagrams.aws.storage import S3
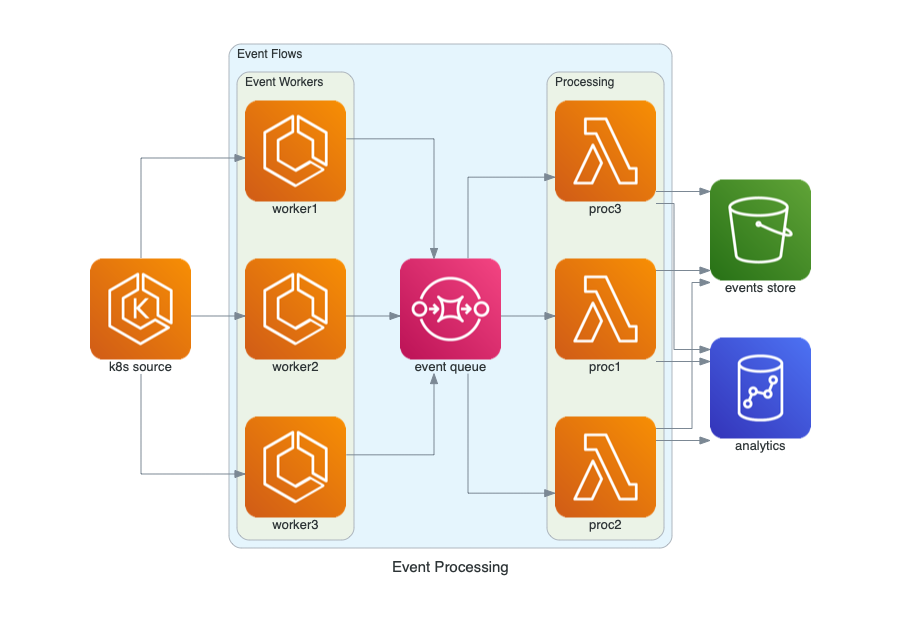
with Diagram("Event Processing", show=False):
source = EKS("k8s source")
with Cluster("Event Flows"):
with Cluster("Event Workers"):
workers = [ECS("worker1"),
ECS("worker2"),
ECS("worker3")]
queue = SQS("event queue")
with Cluster("Processing"):
handlers = [Lambda("proc1"),
Lambda("proc2"),
Lambda("proc3")]
store = S3("events store")
dw = Redshift("analytics")
source >> workers >> queue >> handlers
handlers >> store
handlers >> dw

嵌套没有深度限制。随意创建任意深度的嵌套集群。
9、边缘
Edge表示节点之间的边。
基本
Edge是一个对象,表示具有一些附加属性的节点之间的连接。
一个边缘对象包含三个属性:标签、颜色和样式,它们反映了相应的图形边缘属性。
from diagrams import Cluster, Diagram, Edge
from diagrams.onprem.analytics import Spark
from diagrams.onprem.compute import Server
from diagrams.onprem.database import PostgreSQL
from diagrams.onprem.inmemory import Redis
from diagrams.onprem.aggregator import Fluentd
from diagrams.onprem.monitoring import Grafana, Prometheus
from diagrams.onprem.network import Nginx
from diagrams.onprem.queue import Kafka

with Diagram(name="Advanced Web Service with On-Premise (colored)", show=False):
    ingress = Nginx("ingress")

    metrics = Prometheus("metric")
    metrics << Edge(color="firebrick", style="dashed") << Grafana("monitoring")

    with Cluster("Service Cluster"):
        grpcsvc = [
            Server("grpc1"),
            Server("grpc2"),
            Server("grpc3")]

    with Cluster("Sessions HA"):
        primary = Redis("session")
        primary \
            - Edge(color="brown", style="dashed") \
            - Redis("replica") \
            << Edge(label="collect") \
            << metrics
        grpcsvc >> Edge(color="brown") >> primary

    with Cluster("Database HA"):
        primary = PostgreSQL("users")
        primary \
            - Edge(color="brown", style="dotted") \
            - PostgreSQL("replica") \
            << Edge(label="collect") \
            << metrics
        grpcsvc >> Edge(color="black") >> primary

    aggregator = Fluentd("logging")
    aggregator \
        >> Edge(label="parse") \
        >> Kafka("stream") \
        >> Edge(color="black", style="bold") \
        >> Spark("analytics")

    ingress \
        >> Edge(color="darkgreen") \
        << grpcsvc \
        >> Edge(color="darkorange") \
        >> aggregator
四、例子
详见:https://diagrams.mingrammer.com/docs/getting-started/examples
| Event Processing | Stateful Architecture | Advanced Web Service |
|---|---|---|
 |  |  |
Grouped Workers on AWS
from diagrams import Diagram
from diagrams.aws.compute import EC2
from diagrams.aws.database import RDS
from diagrams.aws.network import ELB

with Diagram("Grouped Workers", show=False, direction="TB"):
    ELB("lb") >> [EC2("worker1"),
                  EC2("worker2"),
                  EC2("worker3"),
                  EC2("worker4"),
                  EC2("worker5")] >> RDS("events")
Clustered Web Services
from diagrams import Cluster, Diagram
from diagrams.aws.compute import ECS
from diagrams.aws.database import ElastiCache, RDS
from diagrams.aws.network import ELB
from diagrams.aws.network import Route53

with Diagram("Clustered Web Services", show=False):
    dns = Route53("dns")
    lb = ELB("lb")

    with Cluster("Services"):
        svc_group = [ECS("web1"),
                     ECS("web2"),
                     ECS("web3")]

    with Cluster("DB Cluster"):
        db_primary = RDS("userdb")
        db_primary - [RDS("userdb ro")]

    memcached = ElastiCache("memcached")

    dns >> lb >> svc_group
    svc_group >> db_primary
    svc_group >> memcached

Event Processing on AWS
from diagrams import Cluster, Diagram
from diagrams.aws.compute import ECS, EKS, Lambda
from diagrams.aws.database import Redshift
from diagrams.aws.integration import SQS
from diagrams.aws.storage import S3

with Diagram("Event Processing", show=False):
    source = EKS("k8s source")

    with Cluster("Event Flows"):
        with Cluster("Event Workers"):
            workers = [ECS("worker1"),
                       ECS("worker2"),
                       ECS("worker3")]

        queue = SQS("event queue")

        with Cluster("Processing"):
            handlers = [Lambda("proc1"),
                        Lambda("proc2"),
                        Lambda("proc3")]

    store = S3("events store")
    dw = Redshift("analytics")

    source >> workers >> queue >> handlers
    handlers >> store
    handlers >> dw

Message Collecting System on GCP
from diagrams import Cluster, Diagram
from diagrams.gcp.analytics import BigQuery, Dataflow, PubSub
from diagrams.gcp.compute import AppEngine, Functions
from diagrams.gcp.database import BigTable
from diagrams.gcp.iot import IotCore
from diagrams.gcp.storage import GCS

with Diagram("Message Collecting", show=False):
    pubsub = PubSub("pubsub")

    with Cluster("Source of Data"):
        [IotCore("core1"),
         IotCore("core2"),
         IotCore("core3")] >> pubsub

    with Cluster("Targets"):
        with Cluster("Data Flow"):
            flow = Dataflow("data flow")

        with Cluster("Data Lake"):
            flow >> [BigQuery("bq"),
                     GCS("storage")]

        with Cluster("Event Driven"):
            with Cluster("Processing"):
                flow >> AppEngine("engine") >> BigTable("bigtable")

            with Cluster("Serverless"):
                flow >> Functions("func") >> AppEngine("appengine")

    pubsub >> flow

Exposed Pod with 3 Replicas on Kubernetes
from diagrams import Diagram
from diagrams.k8s.clusterconfig import HPA
from diagrams.k8s.compute import Deployment, Pod, ReplicaSet
from diagrams.k8s.network import Ingress, Service

with Diagram("Exposed Pod with 3 Replicas", show=False):
    net = Ingress("domain.com") >> Service("svc")
    net >> [Pod("pod1"),
            Pod("pod2"),
            Pod("pod3")] << ReplicaSet("rs") << Deployment("dp") << HPA("hpa")

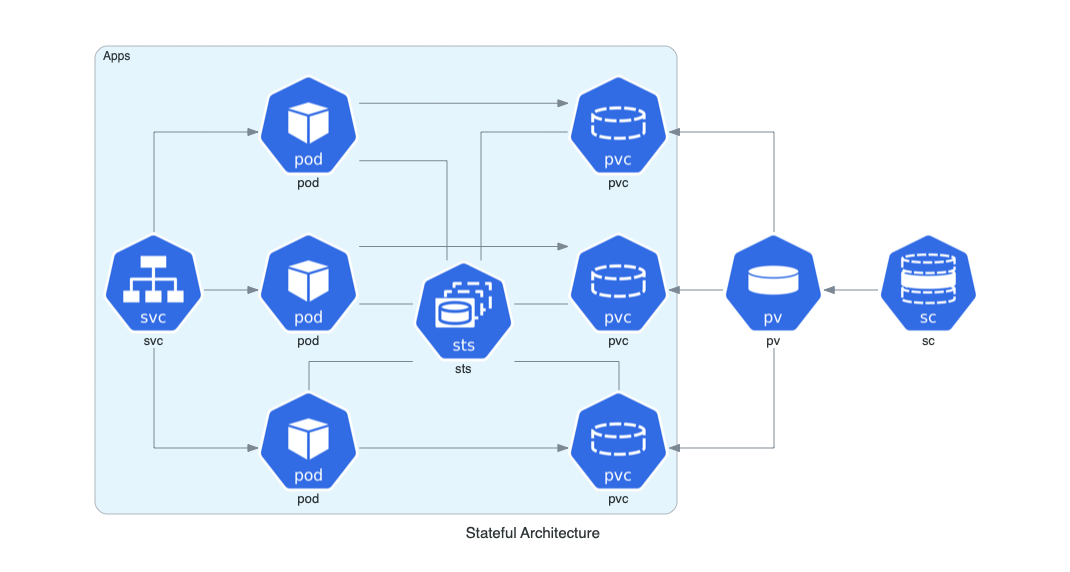
Stateful Architecture on Kubernetes
from diagrams import Cluster, Diagram
from diagrams.k8s.compute import Pod, StatefulSet
from diagrams.k8s.network import Service
from diagrams.k8s.storage import PV, PVC, StorageClass

with Diagram("Stateful Architecture", show=False):
    with Cluster("Apps"):
        svc = Service("svc")
        sts = StatefulSet("sts")

        apps = []
        for _ in range(3):
            pod = Pod("pod")
            pvc = PVC("pvc")
            pod - sts - pvc
            apps.append(svc >> pod >> pvc)

    apps << PV("pv") << StorageClass("sc")
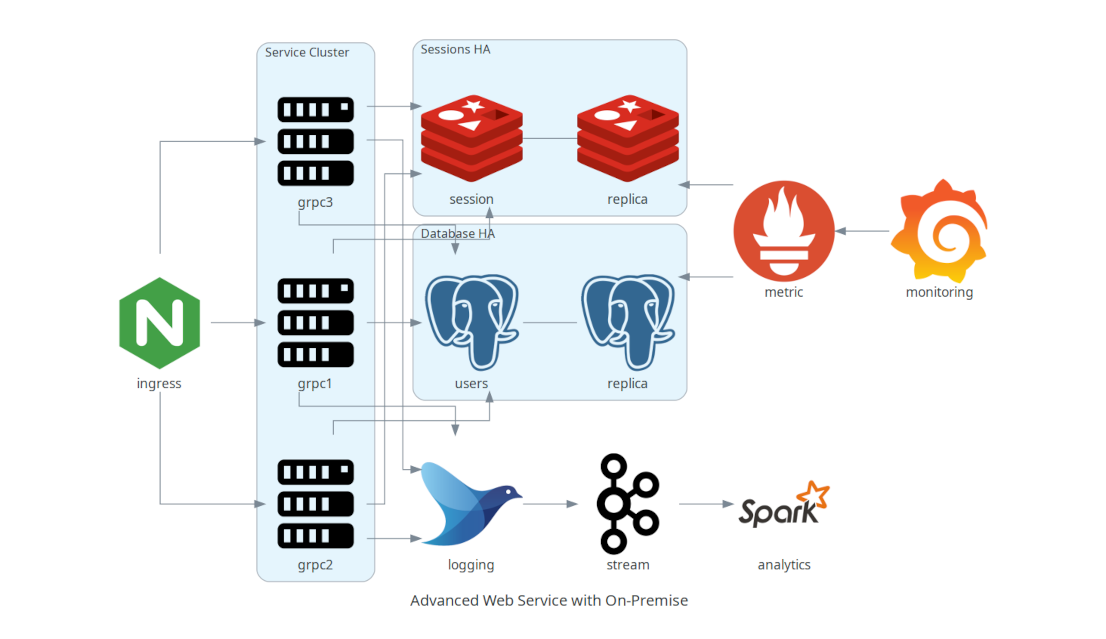
Advanced Web Service with On-Premise
from diagrams import Cluster, Diagram
from diagrams.onprem.analytics import Spark
from diagrams.onprem.compute import Server
from diagrams.onprem.database import PostgreSQL
from diagrams.onprem.inmemory import Redis
from diagrams.onprem.aggregator import Fluentd
from diagrams.onprem.monitoring import Grafana, Prometheus
from diagrams.onprem.network import Nginx
from diagrams.onprem.queue import Kafka

with Diagram("Advanced Web Service with On-Premise", show=False):
    ingress = Nginx("ingress")

    metrics = Prometheus("metric")
    metrics << Grafana("monitoring")

    with Cluster("Service Cluster"):
        grpcsvc = [
            Server("grpc1"),
            Server("grpc2"),
            Server("grpc3")]

    with Cluster("Sessions HA"):
        primary = Redis("session")
        primary - Redis("replica") << metrics
        grpcsvc >> primary

    with Cluster("Database HA"):
        primary = PostgreSQL("users")
        primary - PostgreSQL("replica") << metrics
        grpcsvc >> primary

    aggregator = Fluentd("logging")
    aggregator >> Kafka("stream") >> Spark("analytics")

    ingress >> grpcsvc >> aggregator

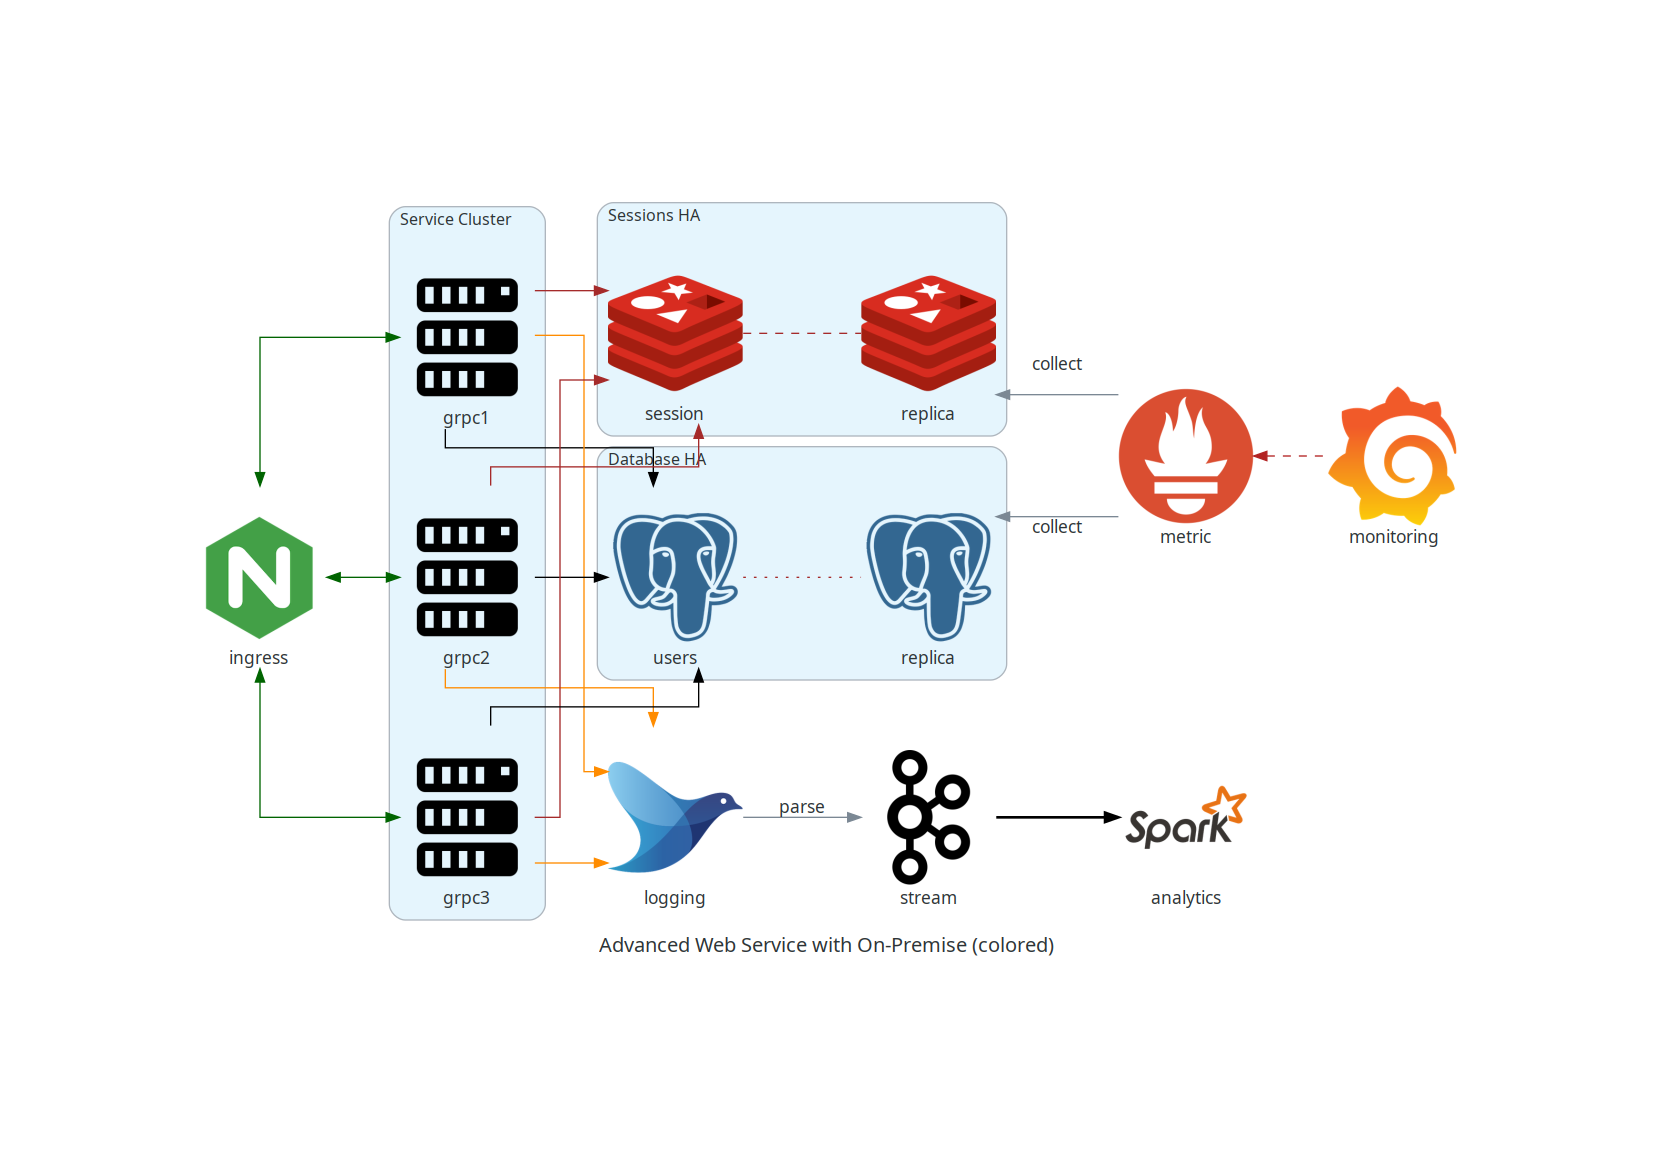
Advanced Web Service with On-Premise (with colors and labels)
from diagrams import Cluster, Diagram, Edge
from diagrams.onprem.analytics import Spark
from diagrams.onprem.compute import Server
from diagrams.onprem.database import PostgreSQL
from diagrams.onprem.inmemory import Redis
from diagrams.onprem.aggregator import Fluentd
from diagrams.onprem.monitoring import Grafana, Prometheus
from diagrams.onprem.network import Nginx
from diagrams.onprem.queue import Kafka

with Diagram(name="Advanced Web Service with On-Premise (colored)", show=False):
    ingress = Nginx("ingress")

    metrics = Prometheus("metric")
    metrics << Edge(color="firebrick", style="dashed") << Grafana("monitoring")

    with Cluster("Service Cluster"):
        grpcsvc = [
            Server("grpc1"),
            Server("grpc2"),
            Server("grpc3")]

    with Cluster("Sessions HA"):
        primary = Redis("session")
        primary - Edge(color="brown", style="dashed") - Redis("replica") << Edge(label="collect") << metrics
        grpcsvc >> Edge(color="brown") >> primary

    with Cluster("Database HA"):
        primary = PostgreSQL("users")
        primary - Edge(color="brown", style="dotted") - PostgreSQL("replica") << Edge(label="collect") << metrics
        grpcsvc >> Edge(color="black") >> primary

    aggregator = Fluentd("logging")
    aggregator >> Edge(label="parse") >> Kafka("stream") >> Edge(color="black", style="bold") >> Spark("analytics")

    ingress >> Edge(color="darkgreen") << grpcsvc >> Edge(color="darkorange") >> aggregator

RabbitMQ Consumers with Custom Nodes
from urllib.request import urlretrieve

from diagrams import Cluster, Diagram
from diagrams.aws.database import Aurora
from diagrams.custom import Custom
from diagrams.k8s.compute import Pod

# Download an image to be used into a Custom Node class
rabbitmq_url = "https://jpadilla.github.io/rabbitmqapp/assets/img/icon.png"
rabbitmq_icon = "rabbitmq.png"
urlretrieve(rabbitmq_url, rabbitmq_icon)

with Diagram("Broker Consumers", show=False):
    with Cluster("Consumers"):
        consumers = [
            Pod("worker"),
            Pod("worker"),
            Pod("worker")]

    queue = Custom("Message queue", rabbitmq_icon)

    queue >> consumers >> Aurora("Database")

五、其它
谁使用它?
Apache Airflow是最流行的数据工作流编排器。Airflow使用图表在其文档中生成架构图。
云发现帮助您分析云中(AWS/美东二机房/Azure/阿里巴巴/IBM)账户中的资源,它允许您基于此图表库创建已分析云资源地图的图表,因此您可以使用云发现绘制您现有的云基础架构。
气流图是一个气流插件,旨在通过图表轻松可视化AWS、美东二机房、Azure等提供商提供的服务级别的气流DAG。
其他语言
- 如果您熟悉Go,您也可以使用 go-diagrams 。
2024-10-02(三)


 556
556

 被折叠的 条评论
为什么被折叠?
被折叠的 条评论
为什么被折叠?
 到【灌水乐园】发言


