


目录
引言
Simpleperf 是一个Android平台上的一个cpu剖析工具,它可以用来分析app进程和native进程,分析Java和C++代码,simpleperf可执行程序最低运行在L版本,python脚本工具最低运行在N版本。–翻译自googlesource
内容
Simpleperf 目录包含两部分:simpleperf 可执行程序和python脚本。python脚本是对simpleperf的封装和调用,基本操作使用脚本更加简单遍历,本文只关注python脚本的入门使用。(直接使用simpleperf可执行程序也可以,需要手动push到设备中去,然后掌握语法就可以)
安装
方法1,simpleperf包含在ndk中,如果已经安装android studio,可从AS上直接下载安装ndk组件,在sdk下命名为ndk-bundle,也可以单独下载ndk。
方法2,单独下载simpleperf压缩包(可根据ndk版本进行选择)
查看下simpleperf根目录
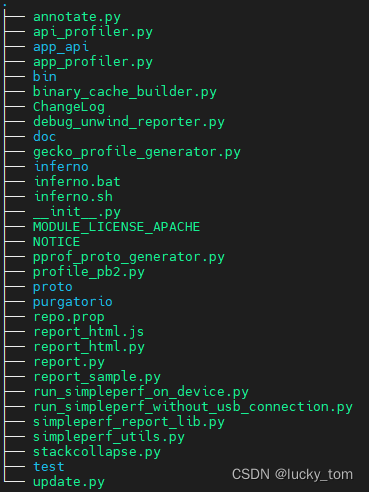
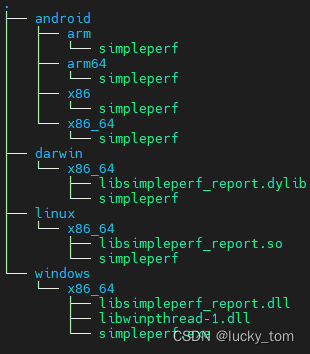
其中,Simpleperf的可执行程序在bin目录下可以看到,不同平台的都提供了,如果只是在windows下,就只需要android和
windows就够了。
采集脚本
我们回头来看看脚本,可以根据他们的功能分为三类:
| 功能 | 脚本 |
|---|---|
| 录制 | app_profiler.py, run_simpleperf_without_usb_connection.py,inferno,run_simpleperf_on_device.py |
| 生成报告 | report.py,report_sample.py |
| 解析数据 | simpleperf_report_lib.py |
那么如何使用呢?看一下官方提供的方法。稍后我们自己实操一下。
app_profiler.py
Record cpu profiling data of an android app or native program.
It downloads simpleperf on device, uses it to collect profiling data on the selected app,
and pulls profiling data and related binaries on host.
查看下使用手册
$ python .\app_profiler.py --help

usage: app_profiler.py [-h]
                       (-p APP | -np NATIVE_PROGRAM | -cmd CMD | --pid PID [PID ...] | --tid TID [TID ...] | --system_wide)
                       [--compile_java_code] [-a ACTIVITY | -t TEST]
                       [-r RECORD_OPTIONS] [-lib NATIVE_LIB_DIR]
                       [-o PERF_DATA_PATH] [-nb] [--ndk_path NDK_PATH]
                       [--disable_adb_root] [--log {
   debug,info,warning}]

app_profiler.py: Record cpu profiling data of an android app or native program.

    It downloads simpleperf on device, uses it to collect profiling data on the selected app,
    and pulls profiling data and related binaries on host.

optional arguments:
  -h, --help            show this help message and exit

Select profiling target:
  -p APP, --app APP     Profile an Android app, given the package name. Like
                        `-p com.example.android.myapp`.
  -np NATIVE_PROGRAM, --native_program NATIVE_PROGRAM
                        Profile a native program running on the Android
                        device. Like `
最低0.47元/天 解锁文章


 8030
8030


 被折叠的 条评论
为什么被折叠?
被折叠的 条评论
为什么被折叠?
 到【灌水乐园】发言


