


20 Useful Commands of ‘Sysstat’ Utilities (mpstat, pidstat, iostat and sar) for Linux Performance Monitoring:
https://www.tecmint.com/sysstat-commands-to-monitor-linux/
http://www.tuicool.com/articles/NJF7Rba
http://www.toutiao.com/a6469442805461811469/ Linux实验室:最常用的Linux系统监控命令
http://soft.chinabyte.com/os/494/12147494.shtml
查看线程:
top -Hc -p <pid>
ps -Tf -p <pid>
查看进程优先级:
ps -efc |grep ora_ 进程优先级:2种系统时序优先级模式:实时模式Real Time(RT) mode,分时模式Time Sharing(TS) mode
ps -efl
htop
pidstat:
http://www.cnblogs.com/ggjucheng/archive/2013/01/13/2858874.html
pidstat -r -p 13252 2 memory
pidstat -d -p 13252 2 disk
pidstat -u [-t] -p 13252 2 CPU
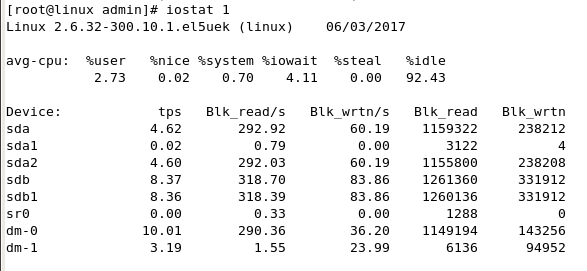
iostat:
http://www.cnblogs.com/ggjucheng/archive/2013/01/13/2858810.html
iostat -d hioa 2
iostat -c 2
iostat -x 2
iostat -k -c -d 2
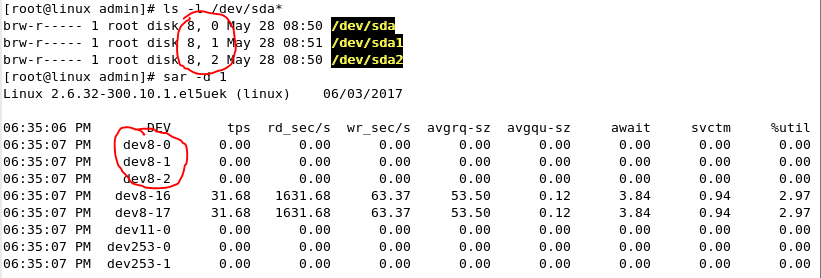
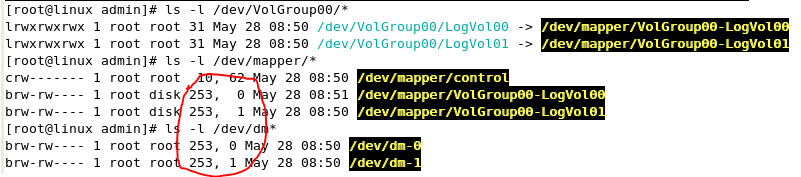
sar:
sar -d 2 tps,io利用率
sar -A
sar -u CPU
sar -n DEV network
netstat -s network
要判断系统瓶颈问题,有时需几个sar命令选项结合起来:
1. 怀疑CPU存在瓶颈,可用sar -u和sar -q等来查看;
2. 怀疑内存存在瓶颈,可用sar -B、sar -r和sar -W等来查看;
3. 怀疑I/O存在瓶颈,可用sar -b、sar -u和sar -d等来查看;
http://blog.chinaunix.net/uid-26230811-id-3265519.html
http://www.2cto.com/os/201304/203050.html
http://blog.chinaunix.net/uid-26230811-id-3265484.html
vmstat
vmstat 2 看可运行队列<=3个线程/cpu
mpstat:
mpstat -P ALL 2
mpstat -p 0
http://bbs.chinaunix.net/thread-4174066-1-1.html
http://blog.csdn.net/wangxin6722513/article/details/43452075
http://blog.csdn.net/chen3888015/article/details/7432868
cpu占用率没有瞬间的概念,取一段时间作为样本,
从 /proc/stat & /proc/[pid]/stat 获取数据,这段时间内 进程的%cpu = 进程(usertime + systime) / 总时间。
进程的usertime + systime可以从 /proc/[pid]/stat 获取;
系统的总时间有2种方法,
1. /proc/stat : 注意,系统的时间除了 用户态、内核态 以外,还有其它如nice时间,具体可以看 手册 man proc,这块我也记不清楚了,需要的话看看手册吧,或者查一查资料
2.采样开始、结束时直接调用 gettimeofday() ,再作差取总时间
PS:注意多核的情形,类似与top命令的irix mode off,系统的总时间还需要乘上核数。
time命令: http://blog.chinaunix.net/uid-26557245-id-3782974.html
nmon -f -t -s 5 -c 360
ganglia
numastat
perf
atop
auditctl
dtrace
Linux 各种查看网卡流量的方法:
http://blog.chinaunix.net/uid-21855486-id-3762505.html


 239
239

 被折叠的 条评论
为什么被折叠?
被折叠的 条评论
为什么被折叠?
 到【灌水乐园】发言


