


结论
1张ExtJS中图中,影响显示的因素有:图像的宽度(width),Y轴坐标标题的宽度(widthOfYTitle)有关,初步推测点数 count 的计算公式为:
count = (width - widthOfYTitle另外,显示的点数与,一张图中画的线的数目、画的点是否是在同一垂线上、图像的X轴的范围没有关系。
需要注意的一点是: 空白点也会占用点的个数,即设置的点的值 为 false,这样在图上就不会显示这个点,但是设置的空白点也算在计算的count之内
为实现结论的测试,我编写的测试代码如下:
<html>
<head>
<title>test-max-amount-of-point</title>
<meta http-equiv="Content-Type" content="text/html; charset=UTF-8">

<link rel="stylesheet" type="text/css" href="../ext-4.0.7-gpl/resources/css/ext-all.css">
<script type="text/javascript" src="../ext-4.0.7-gpl/bootstrap.js"></script>


<script type="text/javascript">

// test variable
var width = 200;
var count = 140;

var maxFieldY = 2;
var	fromDate = new Date(2013, 2, 8, 11, 0, 0);
var	toDate = new Date(2013, 2, 10, 11, 10, 0);

var minimum = 0;

var chart = null;
var store = null;

var colors = [ "#FF0000", "#115fa6","#a61120", "#ff8809", "#ffd13e", "#a61187", "#24ad9a", "#7c7474", "#a66111"];


function generateStore() {

	var coord = [];

	coord.push('x');
	for (var i = 0; i < maxFieldY; i++) {
		var yField = 'y';

		yField = yField + i;

		coord.push(yField);
	}

	if (store == null) {
		store = Ext.create('Ext.data.Store', {
			fields: coord
		});
	}

	// var count = (toDate.getTime() - fromDate.getTime()) / 1000;
	var data = [];

	for (var i = 0; i < count; i++) {
		var obj = {};
		var endObj = {};

		obj.x = new Date(fromDate.getTime() + 1000 * i);
		endObj.x = new Date(fromDate.getTime() + 1000 * (i+1));

		for (var j = 0; j < maxFieldY; j++) {
			var objKey = 'y' + j;

			obj[objKey] = minimum + i%10 + j*2;
			endObj[objKey] = obj[objKey];
		}

		data.push(obj);
		// data.push(endObj);
	}

	store.loadData(data);
}

Ext.onReady(function () {

	generateStore();

	var me = {
		renderTo: 'chart',
		width: width,
		height: 200,
		store: store,
		shadow: false,

		axes: [{
			type: 'Numeric',
			position: 'left',
			fields: ['y0'],
			grid: true,
			minimum: minimum,
			maximum: minimum + 15
		},{
			type: 'Time',
			position: 'bottom',
			fields: ['x'],
			grid: true,
			step: false,
			dateFormat: 'Y-m-d H:i:s',
			fromDate: fromDate,
			toDate: toDate
		}]
	};

	me.series = [];

	// 添加线条
	for (var i = 0; i < maxFieldY; i++) {
		var title = "";

		var yField = 'y';

		yField = yField + i;

		me.series.push({
			type: 'line',
			xField: 'x',
			yField: yField,
			title: title,
			showMarkers: false,
			axis: ['left', 'bottom'],
			style: {
				stroke: colors[i%10],
				'stroke-width': 0
			},
			tips: {
				trackMouse: true,
                width: 200,
                height: 35,
				layout: 'fit',
				renderer: function(storeItem, item) {
					var curDate = null;

					curDate = item.value[0];

					var formatDate = Ext.Date.format(
						curDate,
						'Y-m-d H:i:s'
					);

					var value = item.value[1];

					this.setTitle(
						'date: ' + formatDate +
							'<br>' +
							'value:' + value.toFixed(3)
					);
				}
			}
		});
	}

	chart = Ext.create('Ext.chart.Chart', me);
});


</script>

</head>
<body>

  <div id="chart"></div>

</body>
</html>
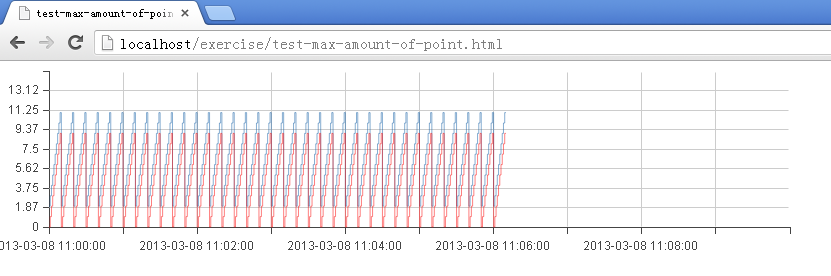
上图为正常显示点的截图。
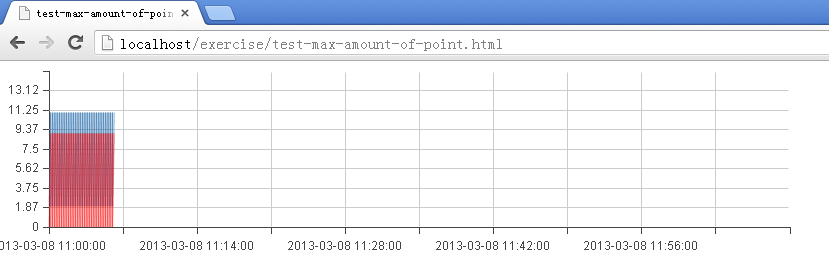
上图为改变时间范围并不影响图像显示的截图
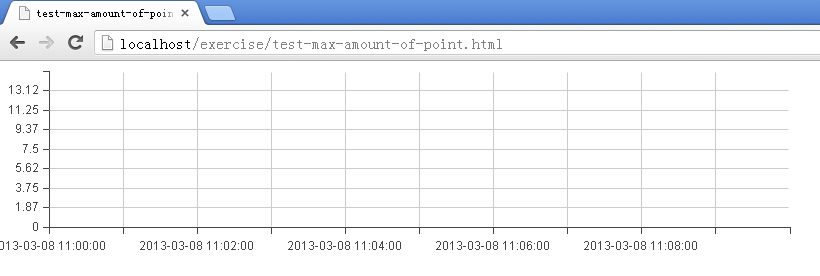
上图为当数据数目过大时,图像不能显示的截图
关于Y轴坐标标题的宽度为影响因素的测试
数据量为 6*60+10 秒为单位的梯状数据图形中
[0, 15] 区间可以显示
[100, 115] 区间不显示图形
关于画的点是否是在同一垂线上为无关因素的测试
1 个 count 只对应于 1 个点的情况
count = (width - widthOfYTitle)
在最大Y轴标题数值为 13.12 时,经过几组数据比较,可以认为 widthOfYTitle 为59
测试 width: 400
count: 340; result: yes
count: 341; result: yes
count: 342; result: no
测试 width: 200
count: 140; result: yes
count: 141; result: yes
count: 142; result: no
1 个 count 只对应于 2 个点的情况
count = (width - widthOfYTitle) / 2
因为每个 count 创建了两个点,
所以实际公式应该修正为 count = (width - widthOfYTitle)
在最大Y轴标题数值为 13.12 时,经过几组数据比较,可以认为 widthOfYTitle 为60
测试 width: 400
count: 169; result: yes
count: 170; result: yes
count: 171; result: no
测试 width: 200
count: 69; result: yes
count: 70; result: yes
count: 71; result: no
关于多条线为无关因素的测试
在时间区间为 6*60+10 秒,
图像宽度设置为 800
Y 轴显示的数据范围 [0, 15]
1 条线的情况: 可以显示
10 条线的情况: 可以显示
20 :可以显示


 8148
8148


 被折叠的 条评论
为什么被折叠?
被折叠的 条评论
为什么被折叠?
 到【灌水乐园】发言


