


LeakCanary学习
A memory leak detection library for Android and Java.
吸着霾写完的人生第一篇博客!
1.配置使用
在build.gradle中配置
 dependencies {
   debugCompile 'com.squareup.leakcanary:leakcanary-android:1.5'
   releaseCompile 'com.squareup.leakcanary:leakcanary-android-no-op:1.5'
   testCompile 'com.squareup.leakcanary:leakcanary-android-no-op:1.5'
}在Application中
public class ExampleApplication extends Application {

  @Override public void onCreate() {
    super.onCreate();
    if (LeakCanary.isInAnalyzerProcess(this)) {
      // This process is dedicated to LeakCanary for heap analysis.
      // You should not init your app in this process.
      return;
    }
    LeakCanary.install(this);
    // Normal app init code...
  }
}至此,4.0以上的系统Activity的内存泄露就会被检测。接下来的分析都基于leakcanary 1.5版本。
2.LeakCanary wathcer
LeakCanary.install(this)方法会返回一个RefWatcher对象,该对象对外提供了
public void watch(Object watchedReference)public void watch(Object watchedReference, String referenceName)
    if (this == DISABLED) {
      return;
    }
    checkNotNull(watchedReference, "watchedReference");
    checkNotNull(referenceName, "referenceName");
    final long watchStartNanoTime = System.nanoTime();
    String key = UUID.randomUUID().toString();
    retainedKeys.add(key);
    final KeyedWeakReference reference =
        new KeyedWeakReference(watchedReference, key, referenceName, queue);

ensureGoneAsync(watchStartNanoTime, reference);方法内生成了watch开始的时间,后边会用于计算,唯一对应的key,并且new了一个KeyedWeakReference对象,然后执行了ensureGoneAsync(final long watchStartNanoTime, 。
final KeyedWeakReference reference)
2.1 KeyedWeakReference
继承自WeakReference<Object>,存储之前生成的key和referenceName。对应于HeapDump中的referenceKey和referenceName。当分析一个heap dump文件时,会查找所有KeyedWeakReference实例,然后找到对应key值的对象,这样就找到了泄露的对象,然后就可以计算最短GC roots。
2.2 HeapDump
Heap Dump is a snapshot of the memory of a Java process at a certain point of time.
在LeakCanary中的HeapDump类是负责存储Heap Dump信息的数据结构。
  /** The heap dump file, which you might want to upload somewhere. */
  public final File heapDumpFile;
  public final String referenceKey;
  public final String referenceName;
  // References that should be ignored when analyzing this heap dump. */
  public final ExcludedRefs excludedRefs;
  /** Time from the request to watch the reference until the GC was triggered. */
  public final long watchDurationMs;
  public final long gcDurationMs;
  public final long heapDumpDurationMs;
类中还定义了一个interface提供analyze方法。
/** Receives a heap dump to analyze. */
  public interface Listener {
    void analyze(HeapDump heapDump);
  }
2.3 WatchExecutor
接下来看到ensureGoneAsync方法:
private void ensureGoneAsync(final long watchStartNanoTime, final KeyedWeakReference reference) {
    watchExecutor.execute(new Retryable() {
      @Override public Retryable.Result run() {
        return ensureGone(reference, watchStartNanoTime);
      }
    });
}watchExecutor是一个WatchExecutor的实例,WatchExecutor是一个接口,定义了一个void execute(Retryable retryable)方法,负责执行或者重试一个Retryable
2.4 Retryable
Retryable也是一个接口,代表一个任务,有DONE和RETRY两种状态和一个run方法。
2.5 最核心的方法
Retryable.Result ensureGone(final KeyedWeakReference reference, final long watchStartNanoTime) {
    long gcStartNanoTime = System.nanoTime();
    long watchDurationMs = NANOSECONDS.toMillis(gcStartNanoTime - watchStartNanoTime);

    removeWeaklyReachableReferences();

    if (debuggerControl.isDebuggerAttached()) {
      // The debugger can create false leaks.
      return RETRY;
    }
    if (gone(reference)) {
      return DONE;
    }
    gcTrigger.runGc();
    removeWeaklyReachableReferences();
    if (!gone(reference)) {
      long startDumpHeap = System.nanoTime();
      long gcDurationMs = NANOSECONDS.toMillis(startDumpHeap - gcStartNanoTime);

      File heapDumpFile = heapDumper.dumpHeap();
      if (heapDumpFile == RETRY_LATER) {
        // Could not dump the heap.
        return RETRY;
      }
      long heapDumpDurationMs = NANOSECONDS.toMillis(System.nanoTime() - startDumpHeap);
      heapdumpListener.analyze(
          new HeapDump(heapDumpFile, reference.key, reference.name, excludedRefs, watchDurationMs,
              gcDurationMs, heapDumpDurationMs));
    }
    return DONE;
}在实际执行的ensureGone方法中:
- 计算出gc开始时间以及watch时长
- 然后移除所有弱引用
- 如果判断链接了debugger,则返回结果为RETRY
- 如果引用移除了,则返回DONE
- 再次触发gc
- 再次移除弱引用
- 再次判断是否对象还被强引用,如果是,则开启分析HeapDump,否则返回DONE
PS:每次WeakReference所指向的对象被GC后,这个弱引用都会被放入与之相关联的ReferenceQueue队列中。
以上过程涉及到了其他一些接口。
2.6 DebuggerControl
如果链接了debugger,则可能debugger会持有对象引用,导致虚假的内存泄露。DebuggerControl是一个接口,提供一个boolean isDebuggerAttached()方法,使得我们可以跳过这个检查。
2.7 GcTrigger
也是一个接口,默认提供了一个来自AOSP的实现,GcTrigger提供了一个在检查引用队列之前触发gc的机会。System.gc()不会每次都执行垃圾回收,Runtime.gc()则是告诉系统现在是合适触发gc的时机。
2.8 HeapDumper
仍然是一个接口,会返回HeapDump对应的文件.
2.9 ExcludedRefs
可以添加一些我们已知的泄露,以避免计算最短强引用时被使用,可以排除一些系统已知的内存泄露等。
2.10

目前我们看的都是来自leakcanary-watcher这个module,Preconditions就是类似Guava提供了一个checkNotNull方法,RefWatcherBuilder就是利用builder模式创建一个RefWatcher对象。
3.LeakCanary android
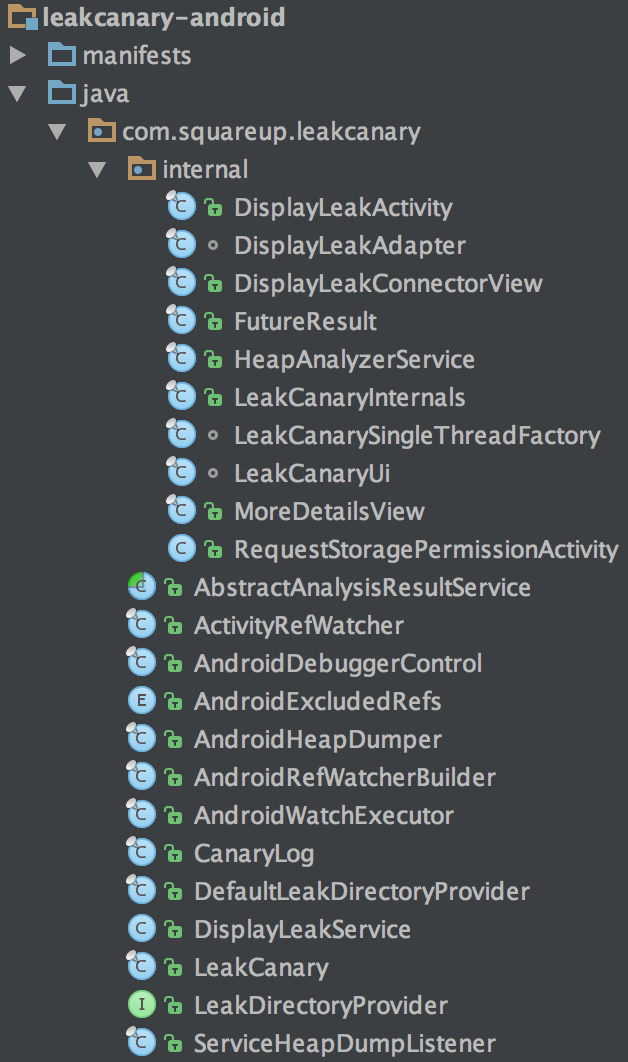
看上面的截图,我们能发现很多眼熟的名字都是针对上面提到的接口的实现。而internal包里则是和处理展示结果相关的。
3.1 初始化
我们回到ExampleApplication中,install中实际使用AndroidRefWatcherBuilder创建了一个RefWatcher,在install中最后调用了AndroidRefWatcherBuilder.buildAndInstall方法,
public RefWatcher buildAndInstall() {
    RefWatcher refWatcher = build();
    if (refWatcher != DISABLED) {
      LeakCanary.enableDisplayLeakActivity(context);
      ActivityRefWatcher.installOnIcsPlus((Application) context, refWatcher);
    }
    return refWatcher;
}这里installOnIcsPlus使得我们直接可以在4.0的设备上检测Activity的内存泄露。因为4.0开始Android引入了ActivityLifecycleCallbacks。4.0以下的设备依然可以使用,只是需要自己处理。
private final Application.ActivityLifecycleCallbacks lifecycleCallbacks =
      new Application.ActivityLifecycleCallbacks() {
        @Override public void onActivityCreated(Activity activity, Bundle savedInstanceState) {
        }

        @Override public void onActivityStarted(Activity activity) {
        }

        @Override public void onActivityResumed(Activity activity) {
        }

        @Override public void onActivityPaused(Activity activity) {
        }

        @Override public void onActivityStopped(Activity activity) {
        }

        @Override public void onActivitySaveInstanceState(Activity activity, Bundle outState) {
        }

        @Override public void onActivityDestroyed(Activity activity) {
          ActivityRefWatcher.this.onActivityDestroyed(activity);
        }
};主要就是在Activity destory时watch这个activity,这就回到了RefWatcher的watch方法。
3.2 AndroidWatchExecutor
我们看一下之前的WatchExecutor的具体实现:
@Override public void execute(Retryable retryable) {
    if (Looper.getMainLooper().getThread() == Thread.currentThread()) {
      waitForIdle(retryable, 0);
    } else {
      postWaitForIdle(retryable, 0);
    }
}在execute中,不管是UI线程还是其他线程,最后都是添加到Looper中一个IdleHandler。
void waitForIdle(final Retryable retryable, final int failedAttempts) {
    // This needs to be called from the main thread.
    Looper.myQueue().addIdleHandler(new MessageQueue.IdleHandler() {
      @Override public boolean queueIdle() {
        postToBackgroundWithDelay(retryable, failedAttempts);
        return false;
      }
    });
}当Looper空闲时,触发postToBackgroundWithDelay,执行之前传入的Retryable,也就是我们上文写到的ensureGone。
3.3 AndroidHeapDumper
之前流程中,通过HeapDumper获取HeapDump的文件,接下来,我们看一下具体的实现:
@Override protected HeapDumper defaultHeapDumper() {
    LeakDirectoryProvider leakDirectoryProvider = new DefaultLeakDirectoryProvider(context);
    return new AndroidHeapDumper(context, leakDirectoryProvider);
}在AndroidRefWatcherBuilder中的defaultHeapDumper方法,构建一个默认的HeapDumper。
@Override public File dumpHeap() {
    File heapDumpFile = leakDirectoryProvider.newHeapDumpFile();

    if (heapDumpFile == RETRY_LATER) {
      return RETRY_LATER;
    }

    FutureResult<Toast> waitingForToast = new FutureResult<>();
    showToast(waitingForToast);

    if (!waitingForToast.wait(5, SECONDS)) {
      CanaryLog.d("Did not dump heap, too much time waiting for Toast.");
      return RETRY_LATER;
    }

    Toast toast = waitingForToast.get();
    try {
      Debug.dumpHprofData(heapDumpFile.getAbsolutePath());
      cancelToast(toast);
      return heapDumpFile;
    } catch (Exception e) {
      CanaryLog.d(e, "Could not dump heap");
      // Abort heap dump
      return RETRY_LATER;
    }
}在ensureGone方法中会调用dumpHeap,并且show toast,就是发生泄漏时我们看到的那个,然后等到handler空闲时,会触发FutureResult的countdown,如果等待的时间超过5秒,会放弃这一次执行,RETRY_LATER,否则会dump hprof数据并关闭toast。
3.3.1 LeakDirectoryProvider
Provides access to where heap dumps and analysis results will be stored.我们可以自己实现这个接口,然后调用LeakCanary.setDisplayLeakActivityDirectoryProvider(LeakDirectoryProvider)
3.3.2 DefaultLeakDirectoryProvider
private File externalStorageDirectory() {
    File downloadsDirectory = Environment.getExternalStoragePublicDirectory(DIRECTORY_DOWNLOADS);
    return new File(downloadsDirectory, "leakcanary-" + context.getPackageName());
  }

  private File appStorageDirectory() {
    File appFilesDirectory = context.getFilesDir();
    return new File(appFilesDirectory, "leakcanary");
}会读取以上两个目录的文件,并且筛选以_pending.hprof结尾的文件。这里还会处理是否有WRITE_EXTERNAL_STORAGE权限,如果在external storage不可写,会切换到app storage。
3.4 ServiceHeapDumpListener
实现了HeapDump.Listener,在analyze方法中调用HeapAnalyzerService.runAnalysis。
3.4.1 HeapAnalyzerService
@Override protected void onHandleIntent(Intent intent) {
    if (intent == null) {
      CanaryLog.d("HeapAnalyzerService received a null intent, ignoring.");
      return;
    }
    String listenerClassName = intent.getStringExtra(LISTENER_CLASS_EXTRA);
    HeapDump heapDump = (HeapDump) intent.getSerializableExtra(HEAPDUMP_EXTRA);

    HeapAnalyzer heapAnalyzer = new HeapAnalyzer(heapDump.excludedRefs);

    AnalysisResult result = heapAnalyzer.checkForLeak(heapDump.heapDumpFile, heapDump.referenceKey);
    AbstractAnalysisResultService.sendResultToListener(this, listenerClassName, heapDump, result);
}HeapAnalyzerService是一个IntentService,会创建一个HeapAnalyzer来checkForLeak,这里就是用到了leakcanary-analyzermodule中的东西了,LeakCanary是使用一个叫HAHA的东西来分析,这里就不介绍了,感兴趣的自己了解吧。因为我也没了解过。分析完的结果会封装到AnalysisResult。
3.4.2 AbstractAnalysisResultService
依然是个IntentService,
@Override protected final void onHandleIntent(Intent intent) {
    HeapDump heapDump = (HeapDump) intent.getSerializableExtra(HEAP_DUMP_EXTRA);
    AnalysisResult result = (AnalysisResult) intent.getSerializableExtra(RESULT_EXTRA);
    try {
      onHeapAnalyzed(heapDump, result);
    } finally {
      //noinspection ResultOfMethodCallIgnored
      heapDump.heapDumpFile.delete();
    }
  }
/**
* Called after a heap dump is analyzed, whether or not a leak was found.
* Check {@link AnalysisResult#leakFound} and {@link AnalysisResult#excludedLeak} to see if there
* was a leak and if it can be ignored.
*
* This will be called from a background intent service thread.
* <p>
* It's OK to block here and wait for the heap dump to be uploaded.
* <p>
* The heap dump file will be deleted immediately after this callback returns.
*/
protected abstract void onHeapAnalyzed(HeapDump heapDump, AnalysisResult result);3.4.3 DisplayLeakService
AbstractAnalysisResultService的实现类。在这里处理后就会弹出notification来通知我们点击查看,进入泄露结果的展示页面。
4 结尾
以上是大致整个的流程。
常见内存泄露
集合类
Vector v = new Vector(10);
for (int i = 1; i < 100; i++) {
    Object o = new Object();
    v.add(o);
    o = null;
}
单列
public class AppManager { private static AppManager instance; private Context context; private AppManager(Context context) { this.context = context; } public static AppManager getInstance(Context context) { if (instance == null) { instance = new AppManager(context); } return instance; } }- 匿名内部类/非静态内部类,异步线程
- Handler 造成的内存泄漏
- 注册了却没有unregister
参考的文章
LeakCanary 内存泄露监测原理研究
LeakCanary原理分析
LeakCanary源码分析第一讲
Android 内存泄漏总结


 559
559

 被折叠的 条评论
为什么被折叠?
被折叠的 条评论
为什么被折叠?
 到【灌水乐园】发言


